
How Much Dividend Income Can You Make With $10,000?
Probably more than you think...

I hate mornings. Give me my coffee and leave me alone.
I have every coffee gadget you can imagine - Nespresso for speed, French press for weekends, Aeropress because someone swore it was magic. But most days? It’s just a boring drip machine.

Every morning, I watch those first few drops hit the pot.
Drip… Drip… Drip…
It seems like it’s going to take forever to finally get my coffee.
I could shake the machine or poke bigger holes in the filter, but that would just give me a mess to clean up or hot water with floating grounds.
So I wait. And those tiny drops keep coming, one after another.

Then suddenly, I have a full pot.
That's dividend investing in a nutshell.
Small amounts, left alone, turn into something big. Those boring little dividend payments might seem pointless at first, just like those first coffee drops.
But give them time to compound, and you'll be surprised what $10,000 can become over 10, 20, or 30 years.
Let's see how those tiny drops add up.
Let’s say you invest $10,000.
Here’s how much income you’d get right now from a few common dividend investments:
SPY (S&P 500 ETF): Around 1.3% yield → $130 per year
Procter & Gamble (PG): Around 2.5% yield → $250 per year
Covered Call ETF (JEPI): Around 8.2% yield → $820 per year
Not exactly life-changing, right?
But here’s the catch: the real power isn’t in year one - these are the first drops.
See, dividend-paying companies do something wonderful.
They tend to raise their payouts over time.
Procter & Gamble has increased its dividend for over 65 years straight
The S&P 500 companies have grown their dividends by about 4.6% per year over the long term
This is where the magic happens.

Let’s see where each one ends up.
SPDR S&P 500 ETF Trust (SPY)
SPY tracks the S&P 500, a basket of 500 big U.S. companies. It’s like buying a piece of America’s economy.
The S&P 500 grows steadily, and those dividends can be reinvested to buy more shares. Over time, the growth will add up.
Over the last 5 years, the S&P has grown its dividend by about 4.6% per year
The price tends to grow about 8% per year
Here’s how that looks over the long-term.
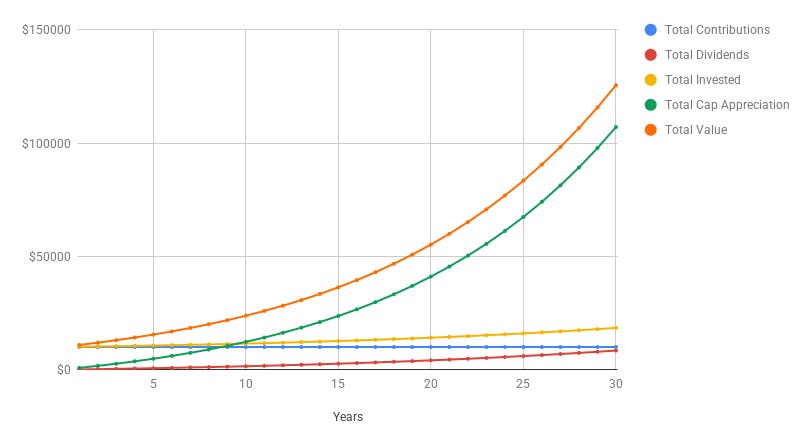
You wind up with a lot of capital gains, but not a lot in dividend income.
10 Years: Your investment would be worth about $24,000 and would pay you about $203/year in dividends.
20 Years: Keep reinvesting, and that $10,000 could grow to $55,000, with $325 in annual dividends.
30 Years: Now you’re looking at more than $125,000, and $537 a year in dividends.
Let’s see how Proctor & Gamble looks.
Procter & Gamble (PG)
Procter & Gamble makes everyday stuff, like Tide detergent and Gillette razors. It’s a steady company that’s paid dividends for decades.
It currently yields about 2.5%, or $250 a year on $10,000. PG raises its dividend regularly, so your income grows even if you don’t add more money.
Over the past 5 years, P&G has increased the dividend by 6.12% per year
The share price has grown at about the same rate - 6.3%
Here’s how that looks over 30 years:

More dividend income than the S&P for sure - let’s play it out over a few decades.
10 Years: With dividend increases and reinvestment, your $10,000 will grow to about $24,000, paying around $630 a year.
20 Years: That could become $56,000, with $1,350 in annual dividends.
30 Years: Your investment might hit $133,000, giving you more than $3,100 a year. That’s real money from soap and toothpaste.
Can a high starting yield do even better?
Covered Call ETF (JEPI)
A Covered Call ETF holds stocks and sells options to boost income. It’s like renting out your stocks for extra cash.
Say it yields 8.2%, or $820 a year on $10,000. The trade-off? Less growth in share price compared to SPY or PG.
But the high dividends can compound nicely if reinvested.
JEPI’s dividend hasn't shown a lot of growth, in fact, over the past 3 years, it’s declined by 1.3% per year
The share price hasn’t moved much either, it’s up about 12.5% over 5 years, or about 2.4% per year.
Let’s use a 1.3% decline in the dividend, and 2.4% share price growth and see what happens:

10 Years: Your $10,000 might grow to $25,000, paying $1,450 a year.
20 Years: That could reach $52,000, with $1,975 in dividends.
30 Years: You might have $91,500, generating $2,400 a year.
Not bad for share price growth that didn’t keep pace with inflation, and a declining dividend.
But Wait, There’s More!
What if we start with a relatively high yield and see strong dividend growth?
Schwab U.S. Dividend Equity ETF (SCHD)
SCHD tracks a group of high-quality U.S. companies with strong histories of paying and growing their dividends. It’s like owning a portfolio of reliable income producers.
The dividend yield is currently about 3.9% and those dividends can be reinvested. Over time, that steady cash flow and compounding can really build wealth.
The 5-year annual dividend growth rate is 10.87%
Since inception, the share price has grown 8.8% per year on average
Here’s what those numbers look like over 30 years:
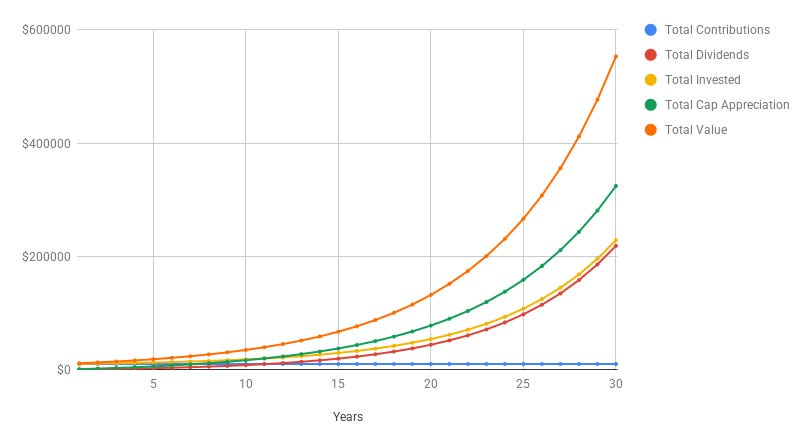
10 Years: Your $10,000 might is now nearly $35,000, paying $1,660 a year.
20 Years: That could reach $132,000 with $6,500 each year in dividends.
30 Years: You’d have nearly $553,000 generating $32,745 (!) a year in passive income.
Conclusion
Same $10,000 investment. Very different results.
The difference? Compounding.
Let It Grow
You don’t need to be rich. You don’t need to time the market.
You just need time and patience.
Put the money in. Reinvest the dividends. Let the companies grow.
And don’t touch it.
Your dividends are like my drip coffee maker.
At first, it seems like you’ll never get the passive income you want.
But then they can cover one of your bills.
Then another.
And eventually you have enough income flowing in to replace your paycheck.
That’s the day you become free.
Want to see this in action with real numbers?
Download the Dividend Growth and Reinvestment Spreadsheet I used to calculate the number in this article here:
Dividend income starts small. But it doesn’t stay that way.
One Dividend At A Time,
-TJ
P.S….
If you want to see the spreadsheet above in action, check out the YouTube version of this article here where I walk through all 4 examples using it:
Used sources
Interactive Brokers: Portfolio data and executing all transactions
Fiscal.ai: Financial data
Is there any SCHD alternative for investors in EU?