

👋 Howdy Partner,
Today we’re diving into one of the most famous REITs in the world.
You know it. You’ve probably seen it nicknamed The Monthly Dividend Company.
It’s Realty Income ($O).

The big debate around Realty Income right now? Some investors think it’s simply gotten too big to keep growing. With a $50B+ market cap and thousands of properties, how much more runway could there be?
At the BofA Global Real Estate Conference this month, management tackled that question head-on. They shared how they plan to keep compounding, even at their size.
Realty Income is known for paying one of the most reliable dividends on the market - month after month, without fail, and raising it for 31 years in a row.
Want to see how they plan to keep this machine growing?
Keep reading.
Company Overview
Realty Income ($O) is one of the largest and most trusted net lease REITs in the world.
They own more than 15,000 properties across the U.S. and Europe, leased to over 1,300 tenants in 85+ industries.
You’ll find names like Walmart, Walgreens, and 7-Eleven cutting checks to Realty Income every month. Those long-term, triple-net leases mean tenants pay the taxes, maintenance, and insurance - leaving Realty Income with steady, predictable cash flow.
As of today, the stock offers a dividend yield of roughly 5.4% - one of the highest levels we’ve seen from this REIT in over a decade.
And remember: this isn’t a quarterly payout. Realty Income pays every single month.
Financial Performance (2015–2024)
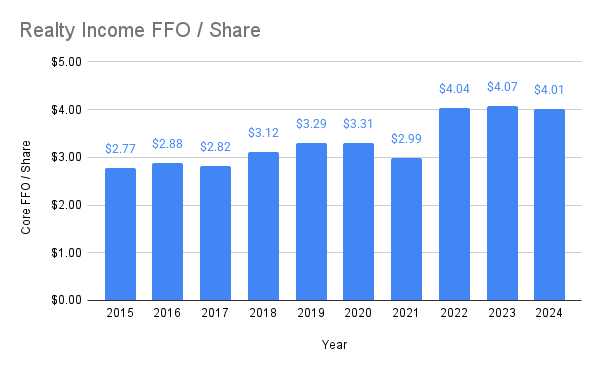
Funds From Operations per Share
FFO per share has been growing relatively steadily at around 4% per year on average:
Revenue & Earnings
2024 Revenue: $5.27 Billion
2024 AFFO per Share: $4.19
2025 AFFO Guidance: $4.24 to $4.28
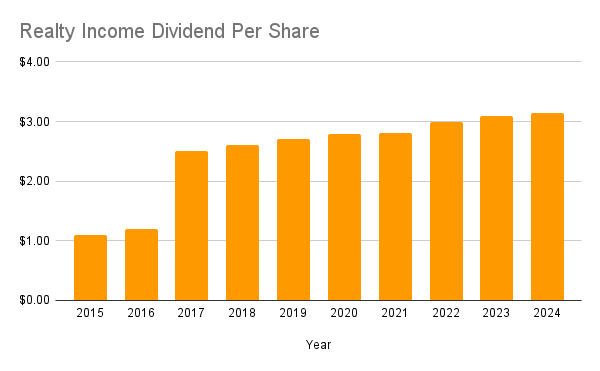
Dividend per Share
Realty Income has increased its dividend for 31 straight years, with a 2.9% 5-year CAGR.
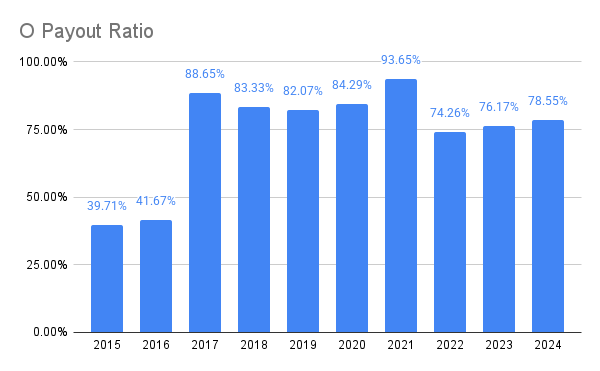
Payout Ratio
Management has kept the Payout Ratio below 80% over the past few years, but from 2017 to 2020, they consistently paid out more than 80% of the FFO in dividends.
Realty Income’s management tends to focus on AFFO/Share, however. That number tends to be higher than FFO, and if we use management’s preferred metric, the payout ratio does come down.
I tend to prefer to use the more conservative metric, which is why I chose FFO/Share.
Outlook for 2025–2026
AFFO Guidance: Management projects 2025 AFFO of around $4.26 per share, indicating continued growth
Occupancy Rates: Portfolio occupancy was at 98.6% at the end of Q2. This is above their historical median of 98.2%.
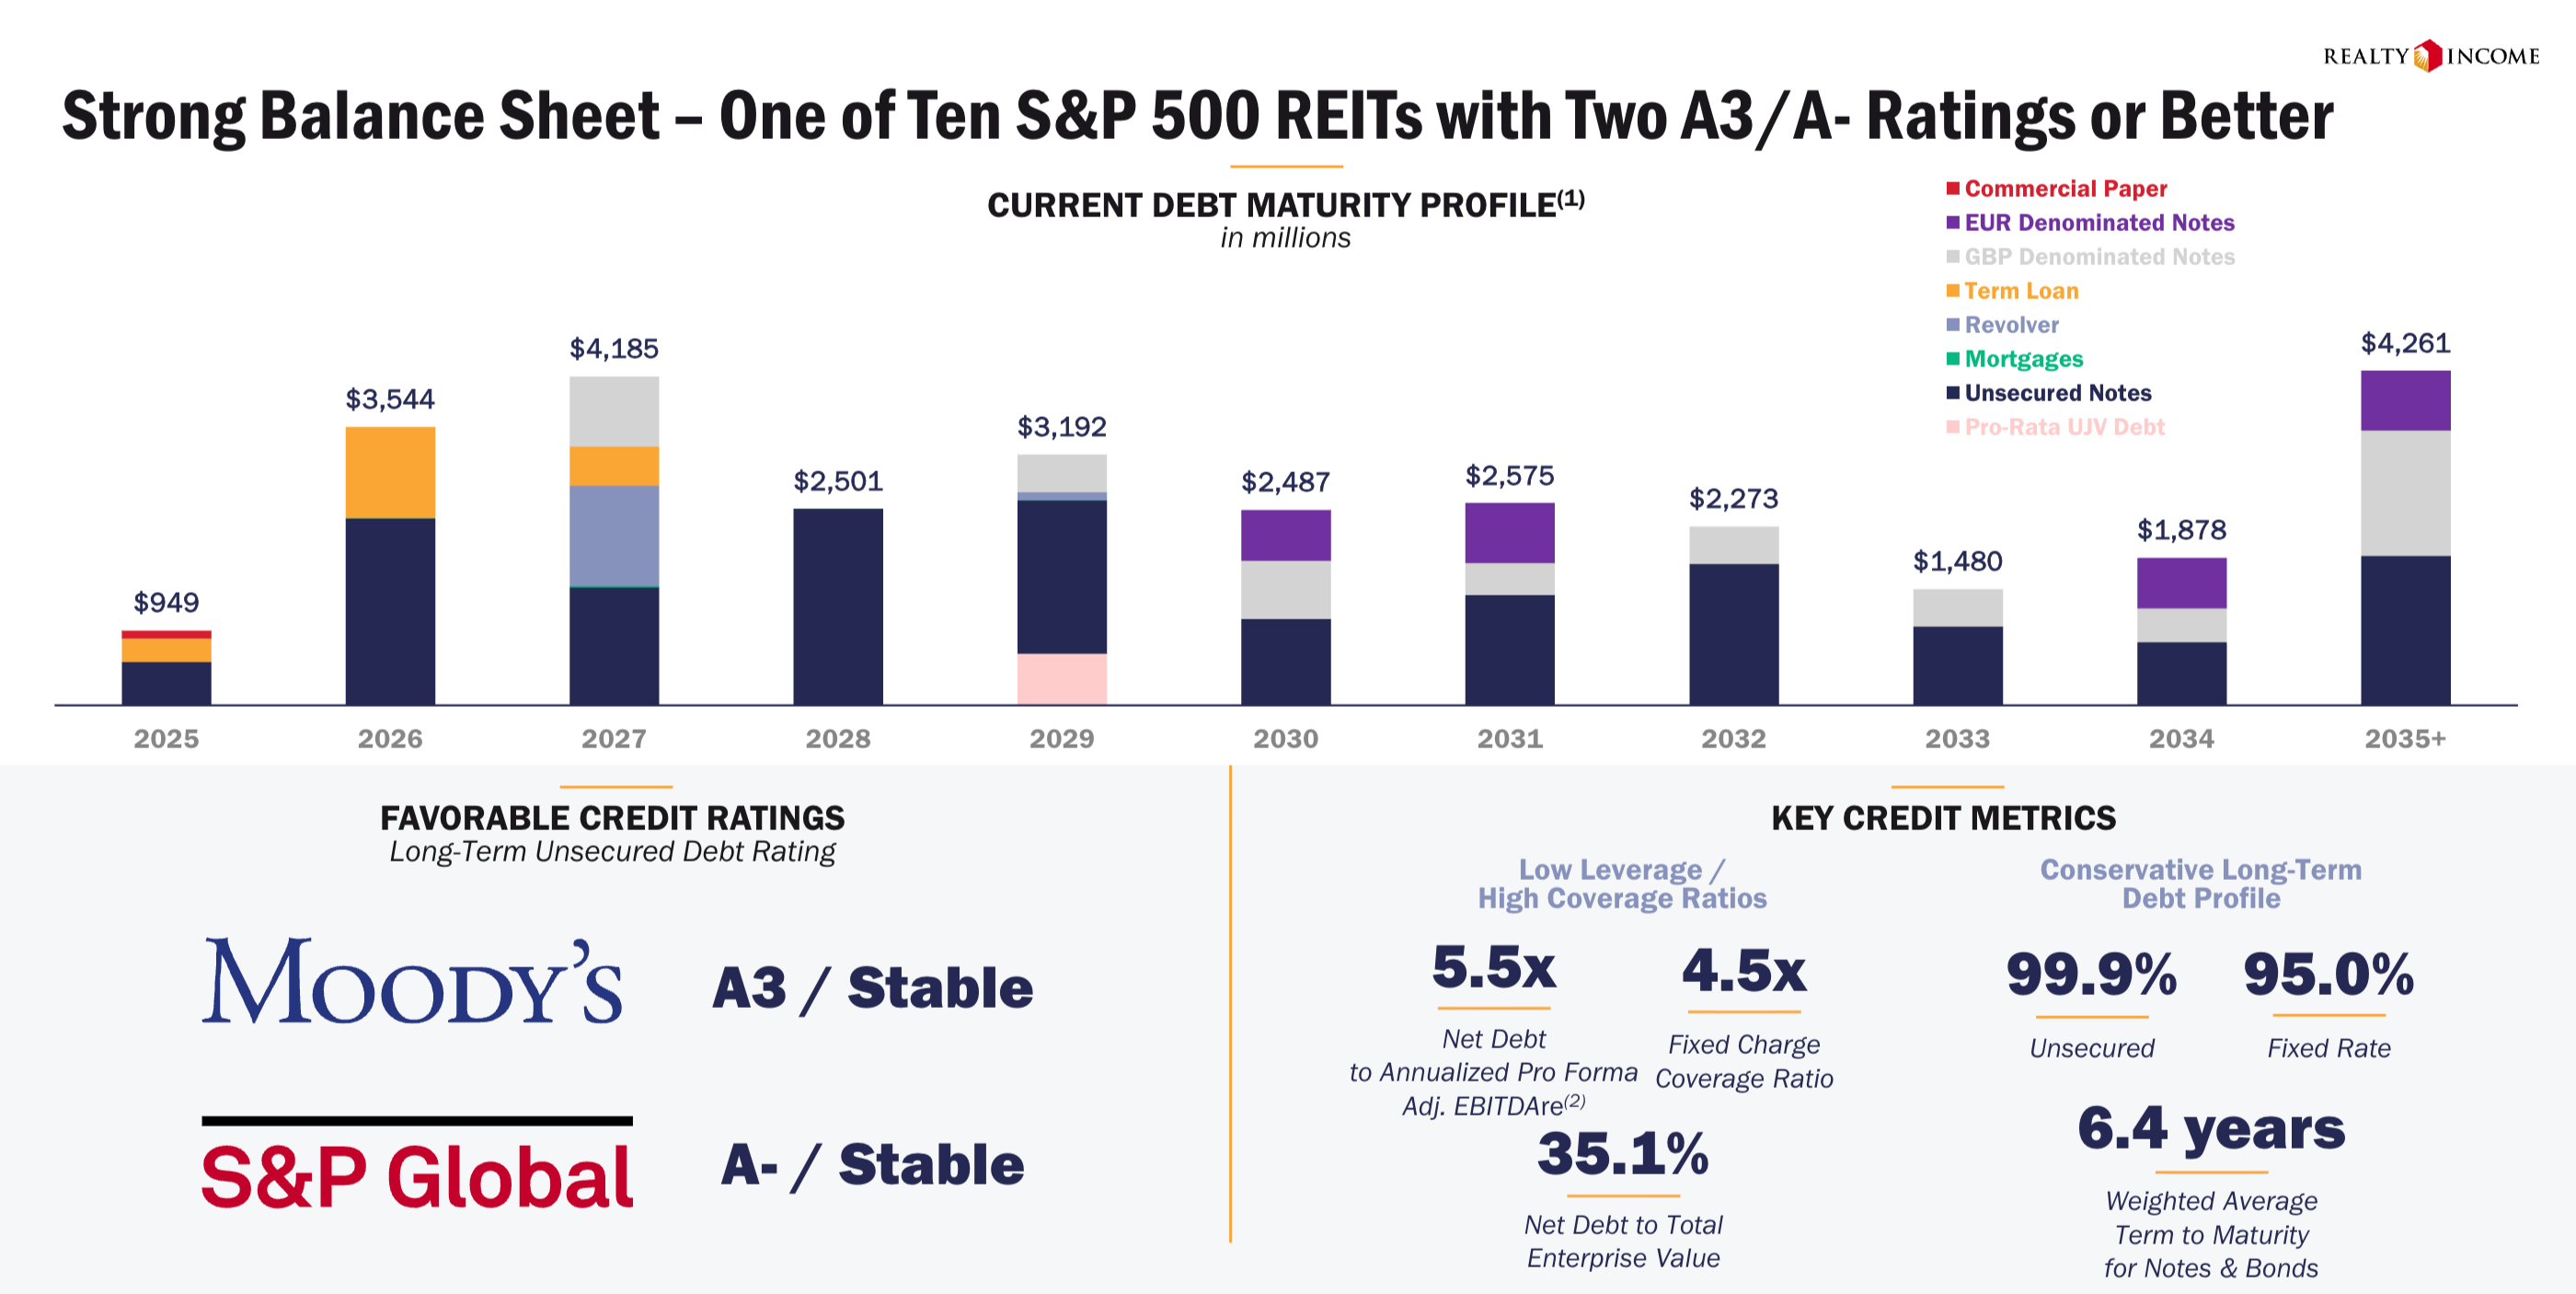
Debt: Realty Income has mostly unsecured, fixed rate debt, with well staggered maturities.
Net Debt to Adjusted EBITDAre: 5.5x
Fixed Charge Coverage Ratio: 4.5x
Credit Rating: A3/A-
Capital Allocation and Growth
Cost of Capital
Cost of capital is important for a REIT - because they have to pay out the majority of earnings as dividends, REITs have to issue equity and raise debt to grow.
Realty Income’s management team lays out for us how they think about financing deals:
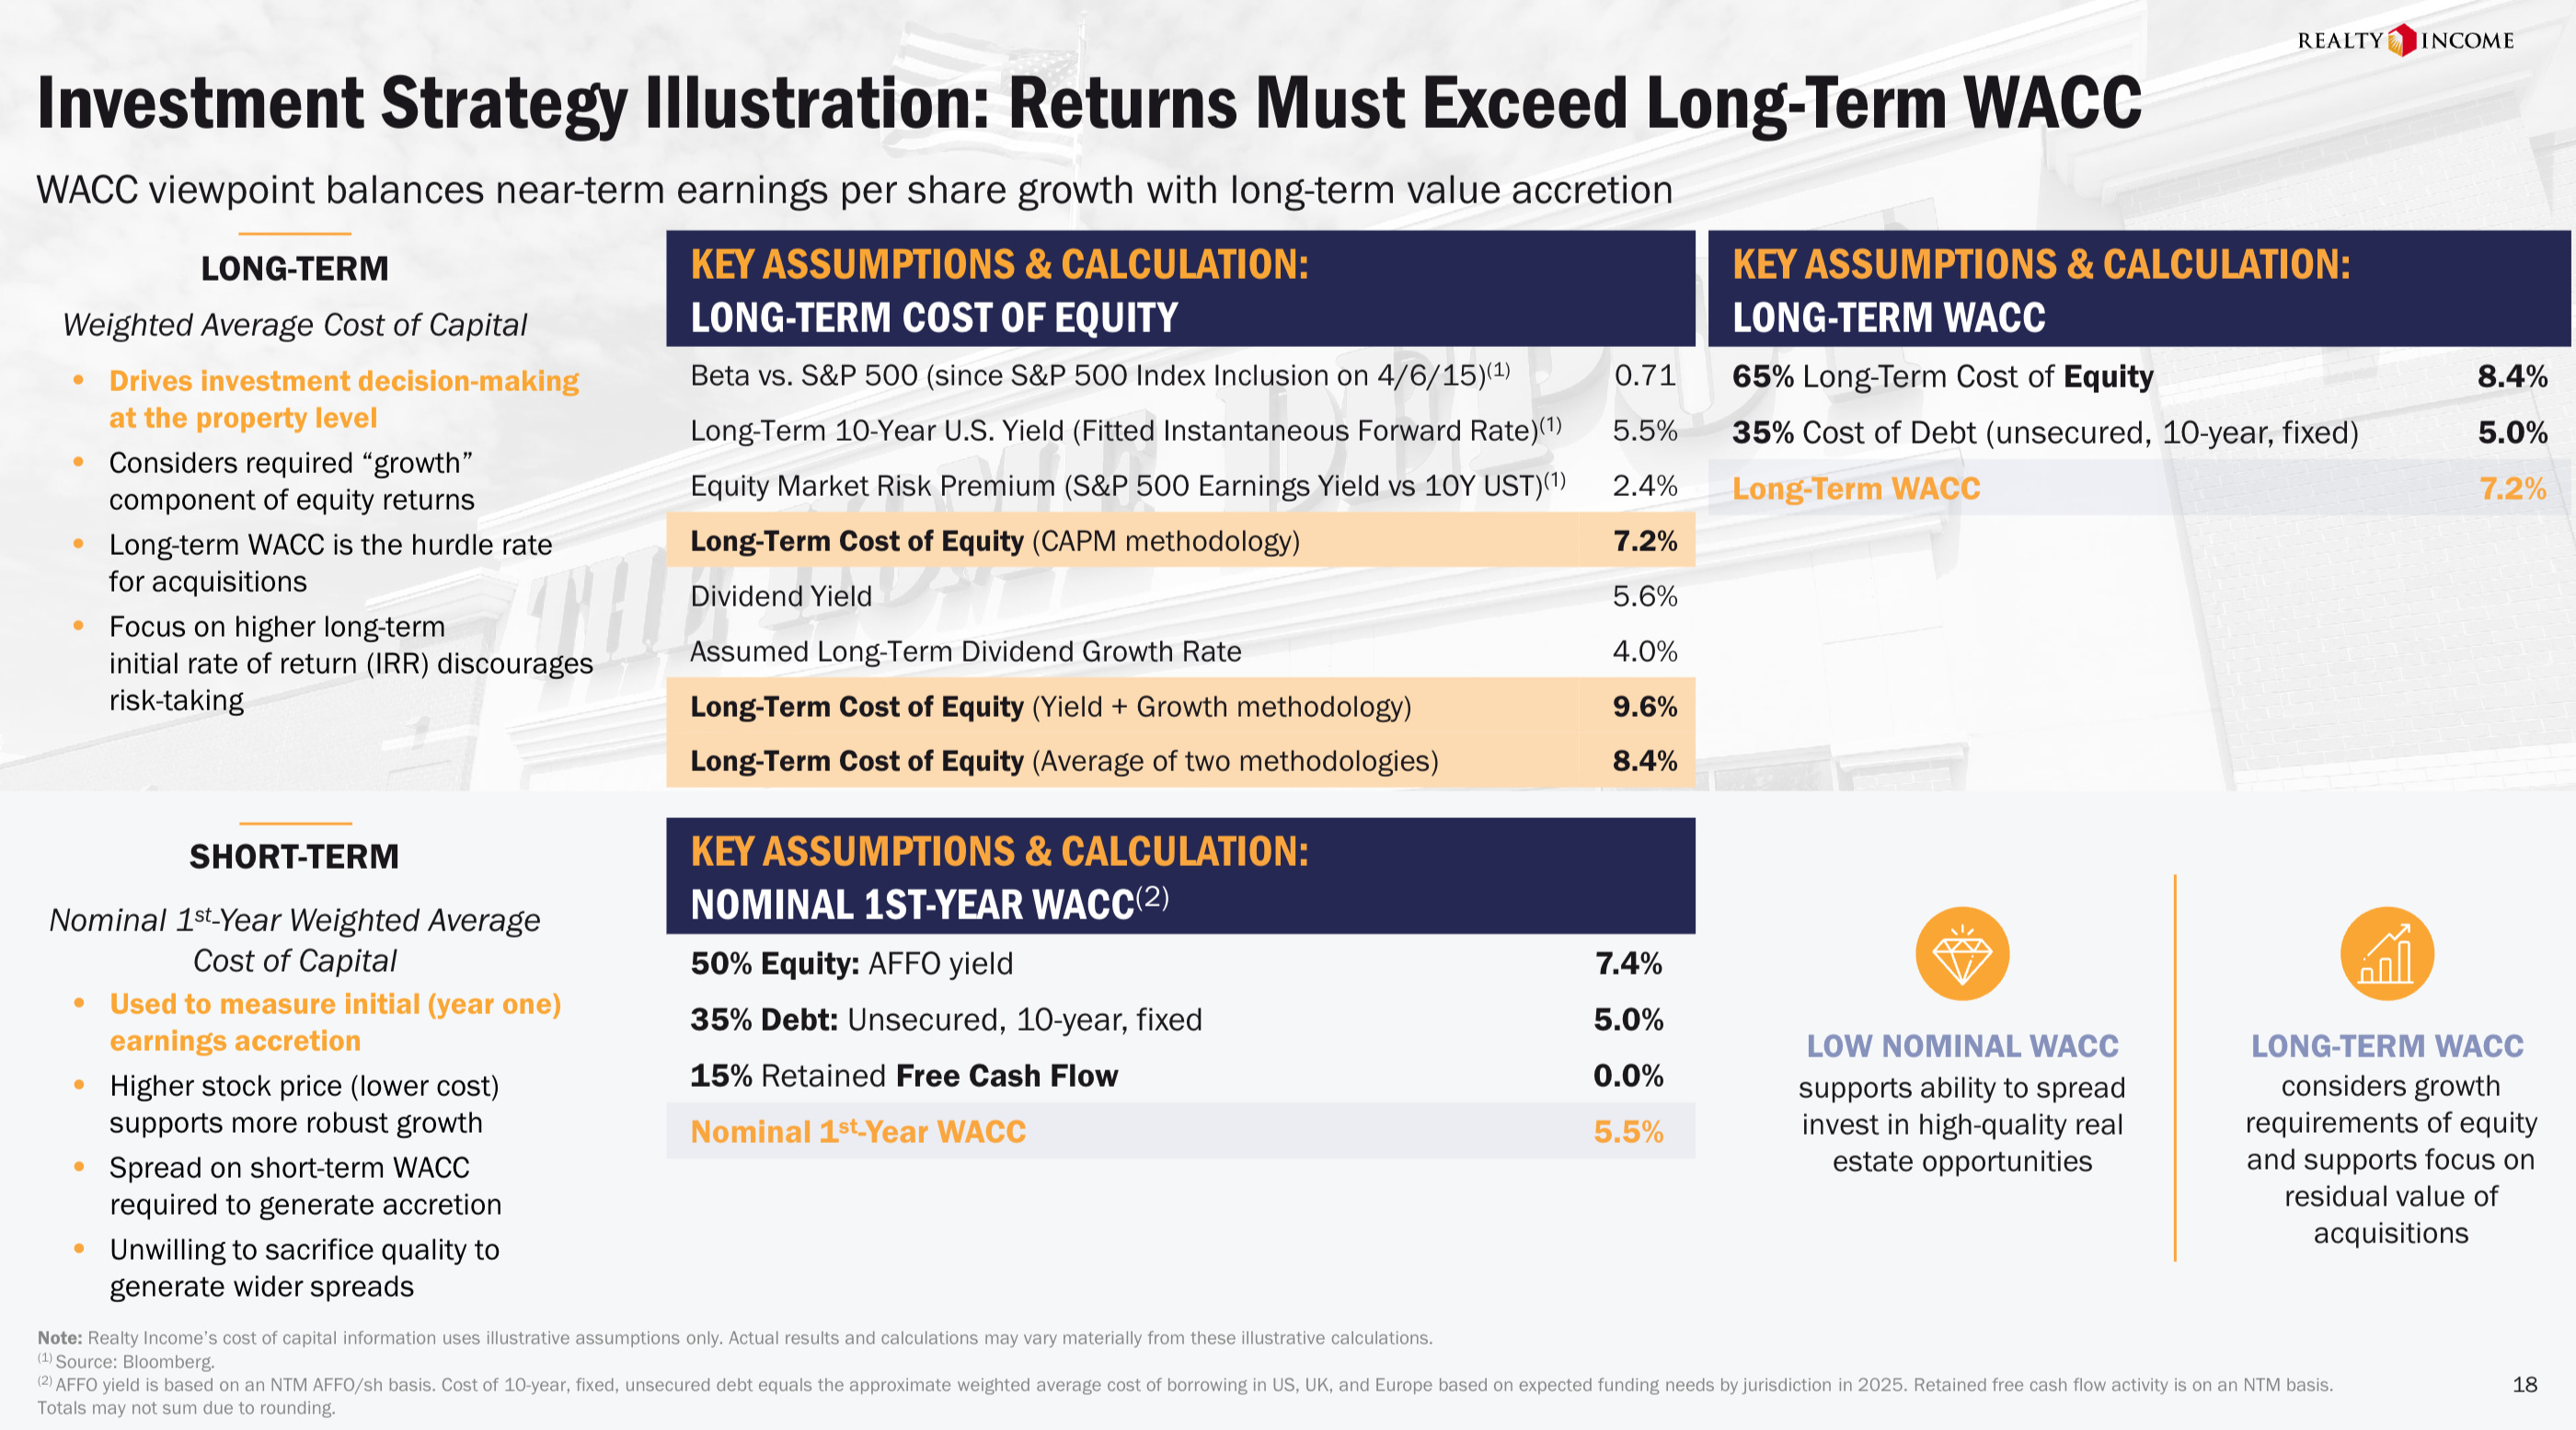
In the short term, management looks to finance a new deal with:
50% equity
35% debt
15% retained cash flow
But over the long term, the cost of a new deal tends to be:
65% equity
35% debt
That puts their long-term cost of capital at around 7.2%
International Expansion
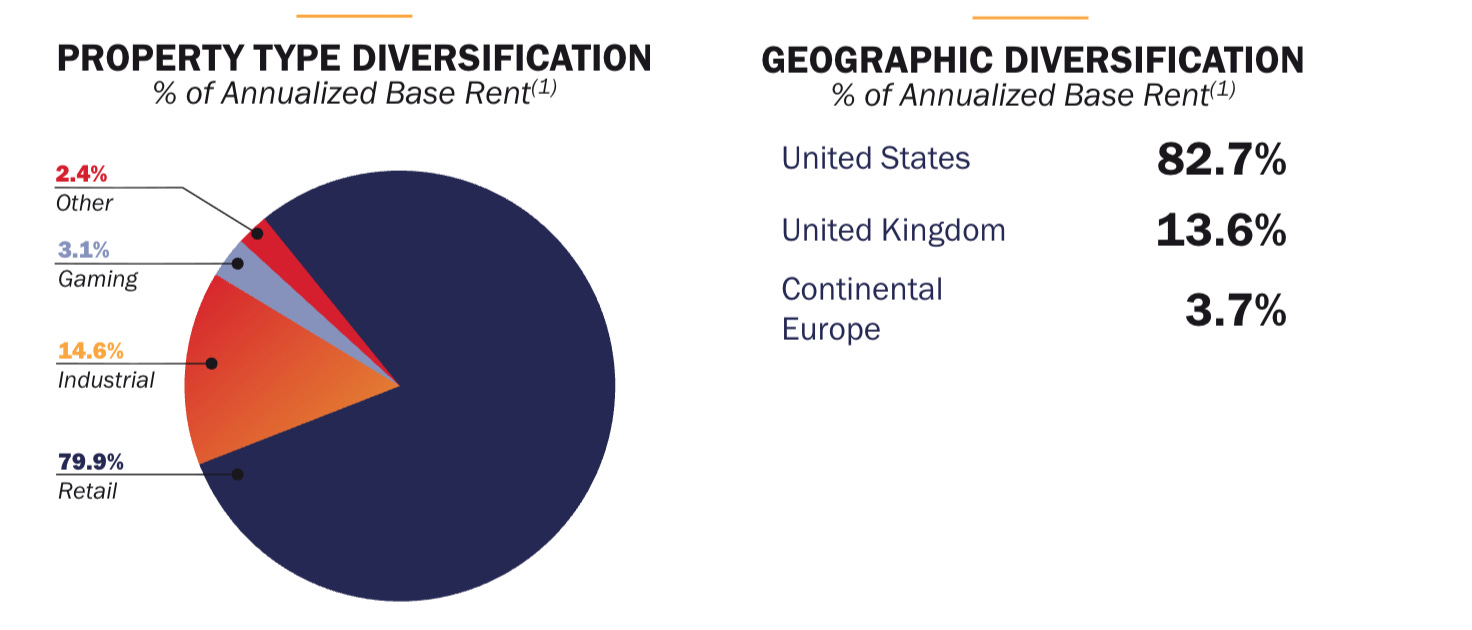
Realty Income has bought up a lot of properties in the United States - 82.7% of their portfolio is U.S. based:
But now, Realty Income is looking at expanding heavily in Europe. The opportunity set is larger there, and there is less competition:
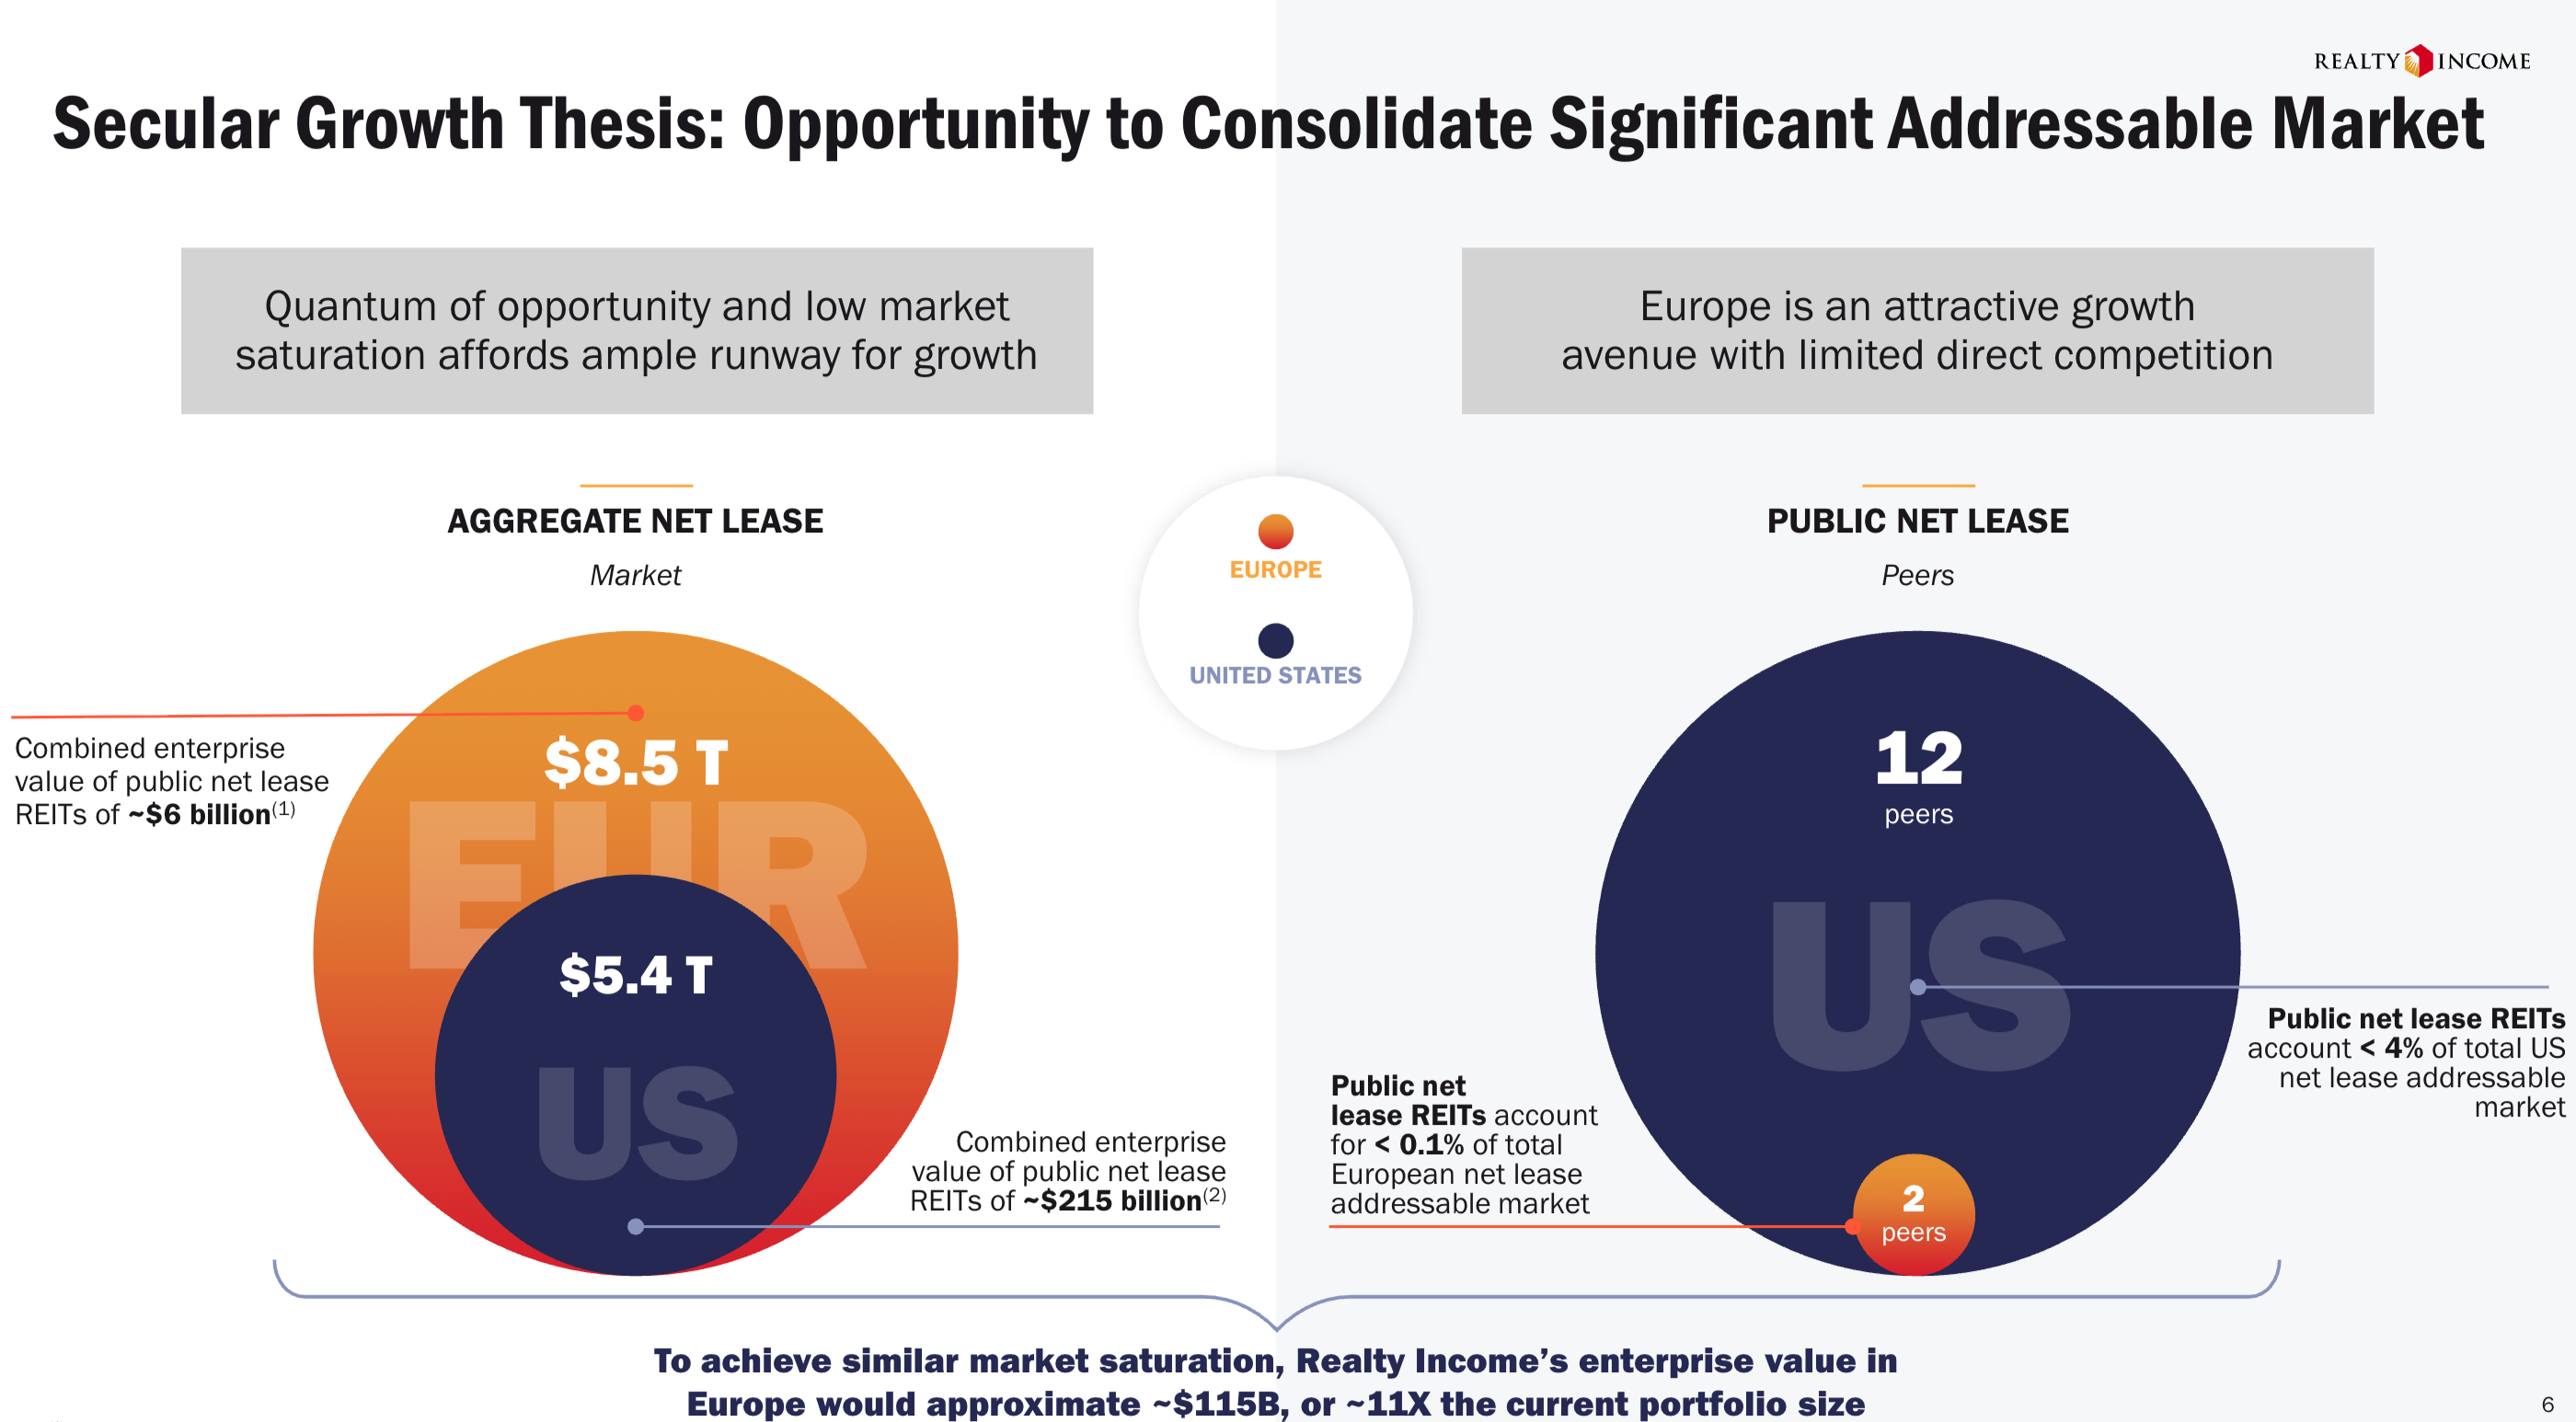
In addition, the initial cash flow is slightly higher in Europe compared to the U.S., but more importantly, unsecured financing is significantly cheaper in Europe - about 3.9%, compared to 5.1% in the U.S.
At the BofA Global Real Estate Conference earlier this month, Sumit Roy (CEO) said that 76% of the real estate the company acquired in Q2 was in Europe.
Data Centers
The other change in strategy that Realty Income announced at the BofA conference was their move into data centers.
I like the key parts of their strategy:
They’re focusing on primary locations (e.g., Northern Virginia, Chicago, Atlanta)
Ensuring triple-net lease structures (or as close to that as possible) to mitigate technology obsolescence risks by making clients responsible for short-shelf-life components like servers, racks, switches, etc. These have 3 to 5 year lifespans and are expensive to replace
Risks and Considerations
Size and Growth Ceiling: Realty Income is massive. With over 15,000 properties, some worry it may be “too big to grow.” Finding enough high-quality deals to move the needle gets harder as the portfolio expands.
Interest Rate Sensitivity: As a REIT, Realty Income depends heavily on debt markets. Rising interest rates increase borrowing costs and make its dividend less attractive compared to bonds.
Retail Exposure: While Realty Income has diversified, a large share of tenants are still retailers. If consumer spending weakens or retail trends shift, certain tenants could face pressure.
Currency and Global Expansion Risk: With expansion into Europe, Realty Income is now exposed to currency swings and unfamiliar regulatory environments.