
🔥 Stock Idea: S&P Global Inc.

S&P Global sets the benchmark for financial world.
The S&P 500 is one of the most popular indexes in the world.
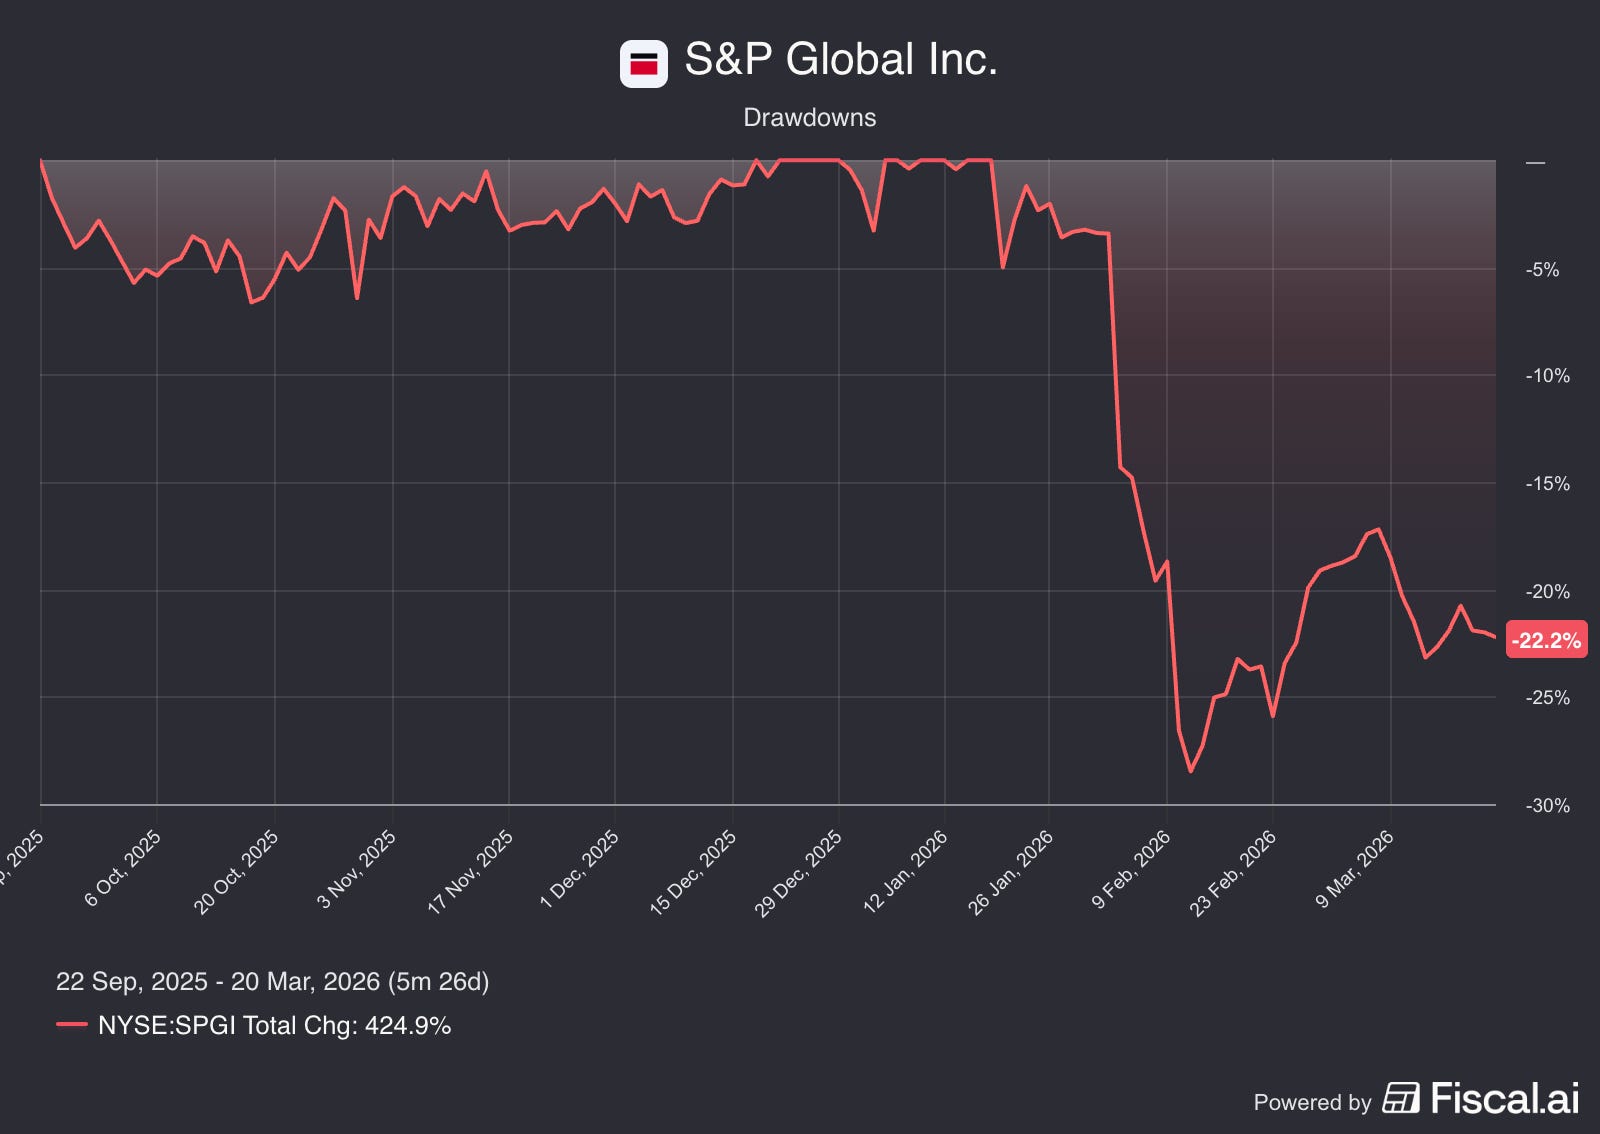
But in the last 6 months, S&P Global’s stock went down -22%.
Is this an interesting opportunity for us? Lets find out.

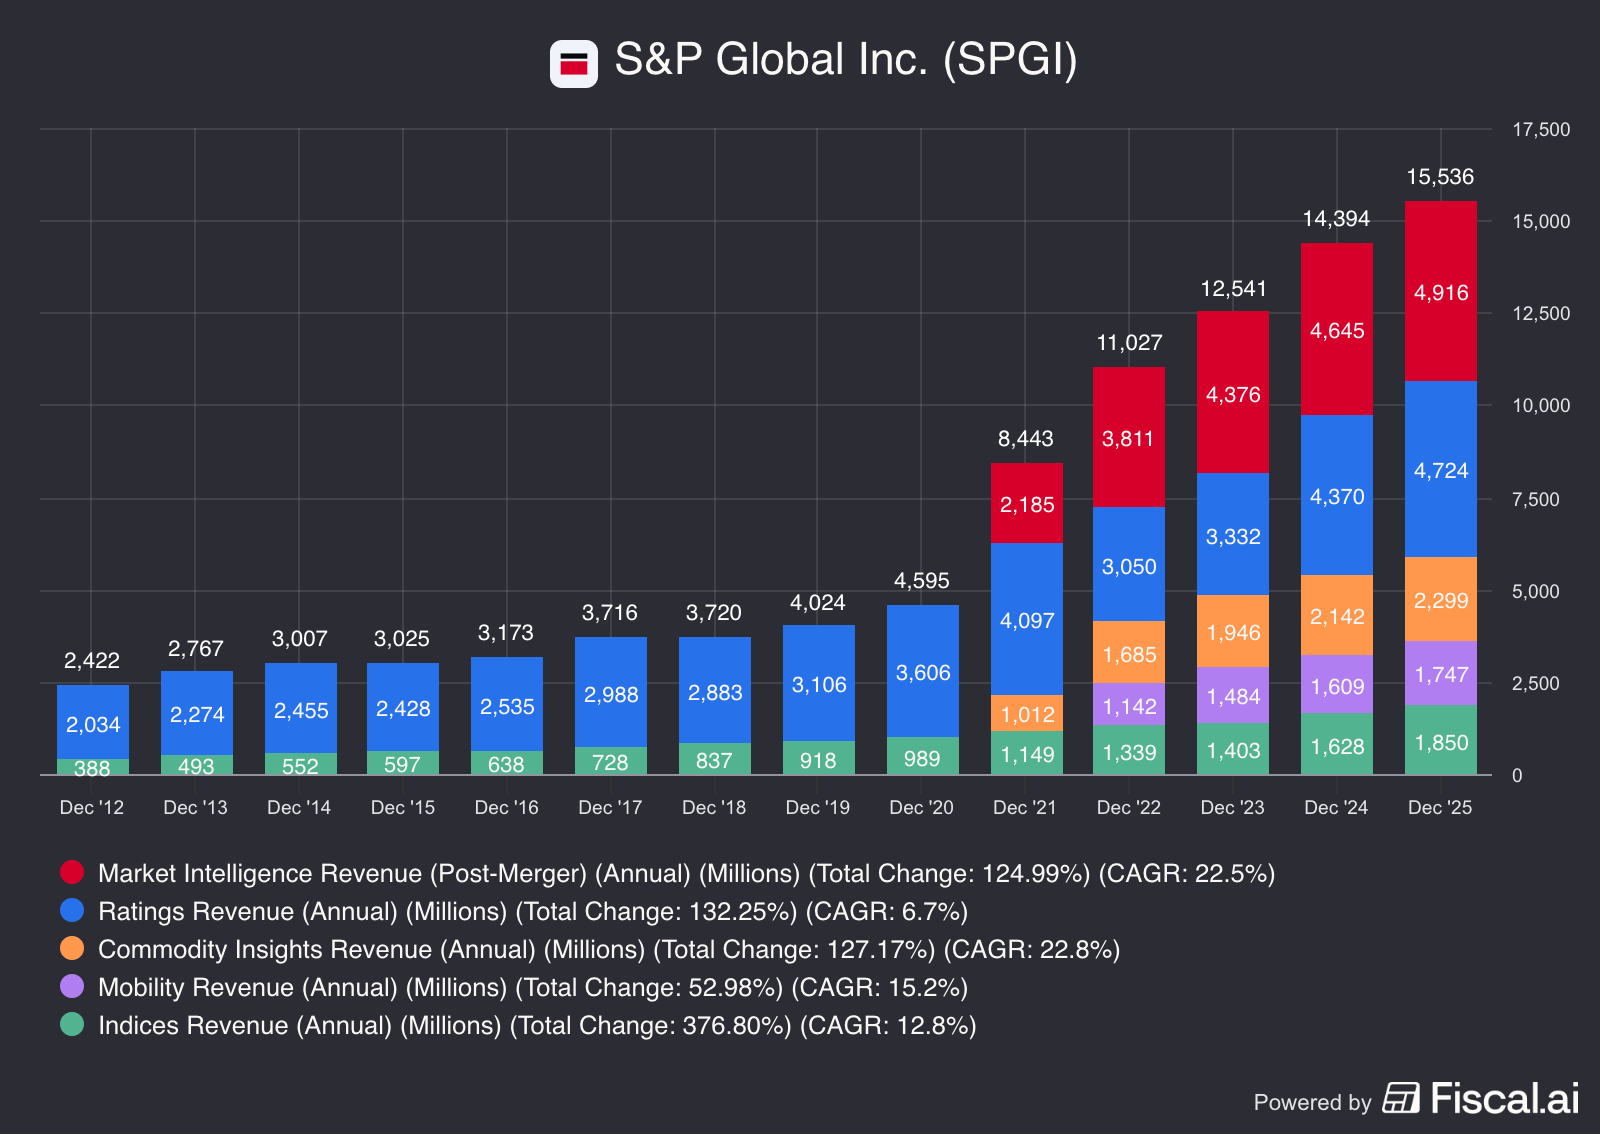
S&P Global is a major U.S. financial data and analytics company that generates more than $14 billion in revenue every year.
They provide credit ratings, market data, indices, and analytics tools for governments, banks, and investors worldwide.
The company is a Dividend King, with 54 years of consecutive dividend raises.
Despite the important place it holds in the financial world, and its history of growth, Mr. Market is very negative on the stock right now.
Why?
Fear that AI will disrupt its analytics business
Confusion and uncertainty around the ongoing IHS Markit integration, restructuring, and spin-offs
Let’s take a Not So Deep Dive into the company to get a clear picture.
Company Profile
Company name: S&P Global Inc.
✍️ ISIN: US78409V1044
🔎 Ticker: $SPGI
📚 Type: Dividend King / Quality Growth
📈 Stock Price: $425
💵 Market cap: $126.4 Billion
📊 Average daily volume: $751 Million
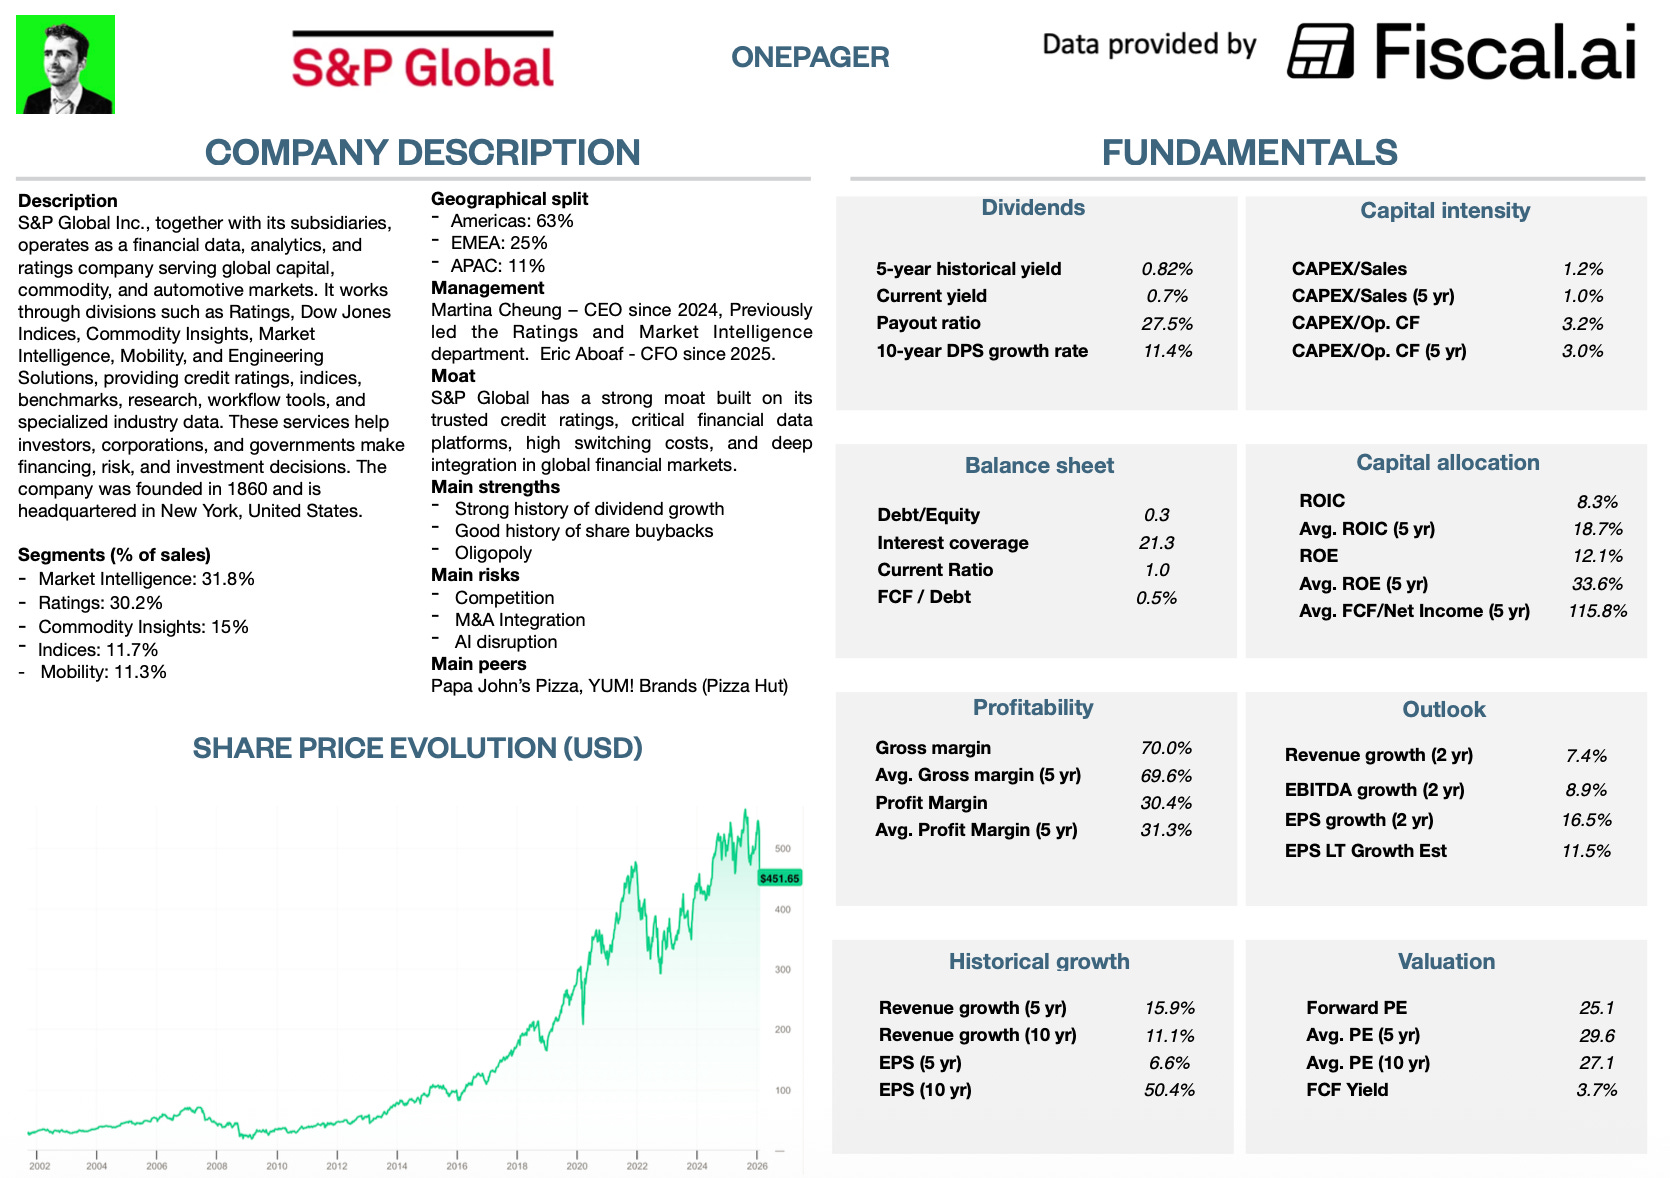
Onepager
Don’t know S&P Global?
Here are the basics (click on the picture to expand):
Now let’s dive into the full investment case!
1. Do I understand the business model?
Even people who don’t follow finance have likely heard of the S&P 500.
This is the most widely used benchmark for the U.S. stock market.
The index is owned and managed by S&P Global through its indices division.

The three largest ETFs in the world all track the S&P 500.
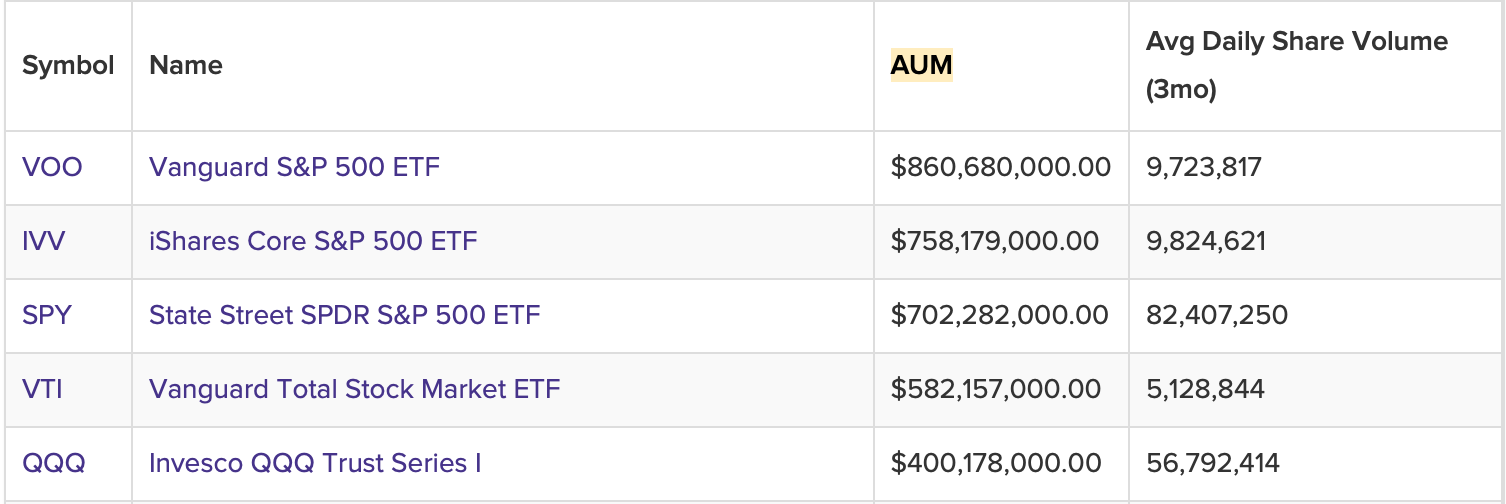
Together, they have more than $2 Trillion (!) in assets.
But indexes aren’t all S&P Global does
The company makes money from 5 different segments.
Revenue Segmentation
Market Intelligence (32% of revenue) : Professional data software for financial analysts
Ratings (30% of revenue) : The world’s largest credit rating agency
Commodity Insights (15% of revenue) : Benchmark prices for energy and metals (Platts)
S&P Dow Jones Indices (12% of revenue) : Fees from ETFs and derivatives tracking their indexes
Mobility (11% of revenue) : Data for the automotive industry (CARFAX)
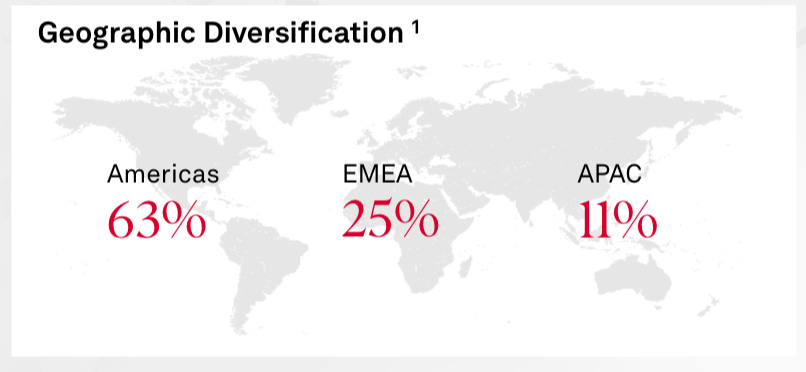
Geographic Split
Americas: 63%
EMEA: 25%
APAC: 11%
What’s the moat?
S&P Global’s moat is built on Network Effects, Intangible Assets, and Regulatory Barriers.
Network Effects
Indices
The S&P 500 is rapidly becoming the standard benchmark.
That drives more assets under management (AUM) into S&P linked products (like the SPY and VOO ETFs).
The increased AUM makes these products more liquid, driving more and more institutional investors into S&P indices, which creates a self-reinforcing flywheel.

Credit Ratings
The credit ratings business also has network effects.
That’s because S&P credit ratings are a common standard in debt markets.
This creates a two-sided network:
For Investors: They use S&P because most companies are already rated by them - it’s a common yardstick they use to compare risks.
For Companies: They pay S&P because that’s the language investors and lenders speak. A rating from a smaller, unknown agency won’t help them borrow money.
The more investors who rely on S&P ratings, the more companies are forced to pay for them.
The more companies S&P rates, the more essential they become to investors.
![What is a two-sided marketplace? [Definition + examples] | Zapier](https://substackcdn.com/image/fetch/$s_!kQ0D!,f_auto,q_auto:good,fl_progressive:steep/https%3A%2F%2Fsubstack-post-media.s3.amazonaws.com%2Fpublic%2Fimages%2Ff1492e3e-0dd2-4f6e-88a7-2be2b68b2223_1400x904.png "What is a two-sided marketplace? [Definition + examples] | Zapier")
The rating business is an Oligopoly, including S&P Global, Moody’s, and Fitch.
Because these companies have been in the business for over a century, their rating scales (like AAA to D) have become the legal language of finance.
Regulatory Barriers
Many laws and contracts actually require S&P ratings, creating additional regulatory barriers.
For example, a pension fund’s rules might say: “We can only buy bonds rated BBB or higher by S&P.”
This makes it almost impossible for a new competitor to enter the market.
Intangible Assets
In addition to the strong brand S&P Global has in the index and credit ratings business, they also have a lot of proprietary data.
Historical Data: S&P has credit records and stock market data going back to the early 1900s. This would be very hard to purchase or recreate without going through them.
Platts Commodity Data: In markets like jet fuel or North Sea oil, there is no official stock exchange. S&P reporters call traders to collect data and set the price themselves. That Platts price is their private property, and the entire world uses it as the standard.
Private Markets: They recently bought With Intelligence, which gives them a massive database on private equity and hedge funds - data that isn’t public and is famously hard to get.
CARFAX: S&P owns records on over 20 billion vehicle events (accidents, repairs, titles). This data comes from thousands of unique sources (police, shops, DMVs) which took decades to connect
2. Is management capable?
Martina L. Cheung - CEO
Ms. Cheung took over as CEO in late 2024.
She previously led the Ratings and Market Intelligence division, one of the most important divisions.

Eric Aboaf - CFO
Mr. Aboaf joined in 2025 from State Street.
He is known for disciplined capital allocation and is currently overseeing the $2.5 billion share repurchase program and the separation of the Mobility business.

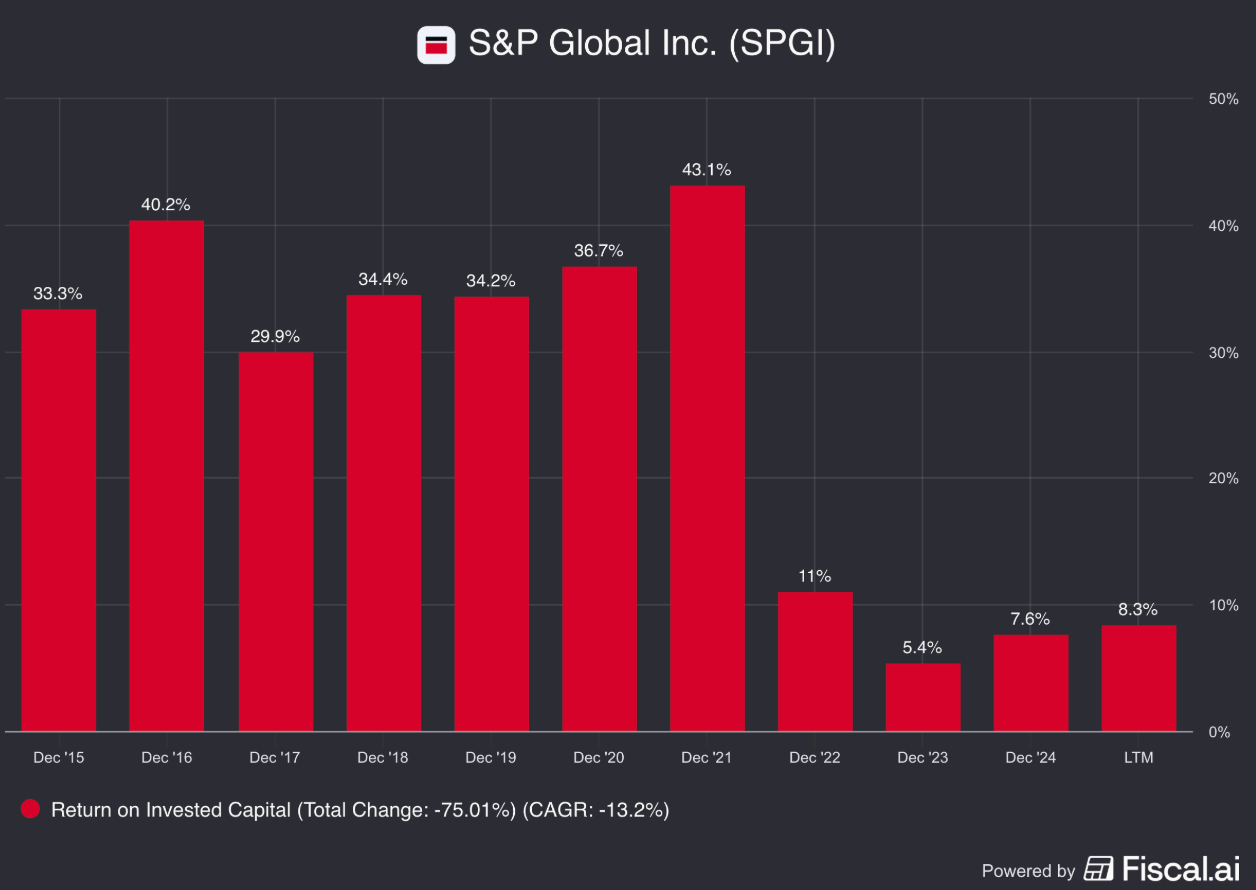
We often assess management through their capital allocation skill.
S&P Global’s ROIC decreased over the years.
This is almost entirely due to a single acquisition.
S&P Global bought IHS Markit for $44 billion which sharply increased the money invested in the business
This also added a lot of Goodwill that has to be amortized, which lowers earnings
The combination of lower profits and a much bigger base of invested capital makes ROIC look much lower
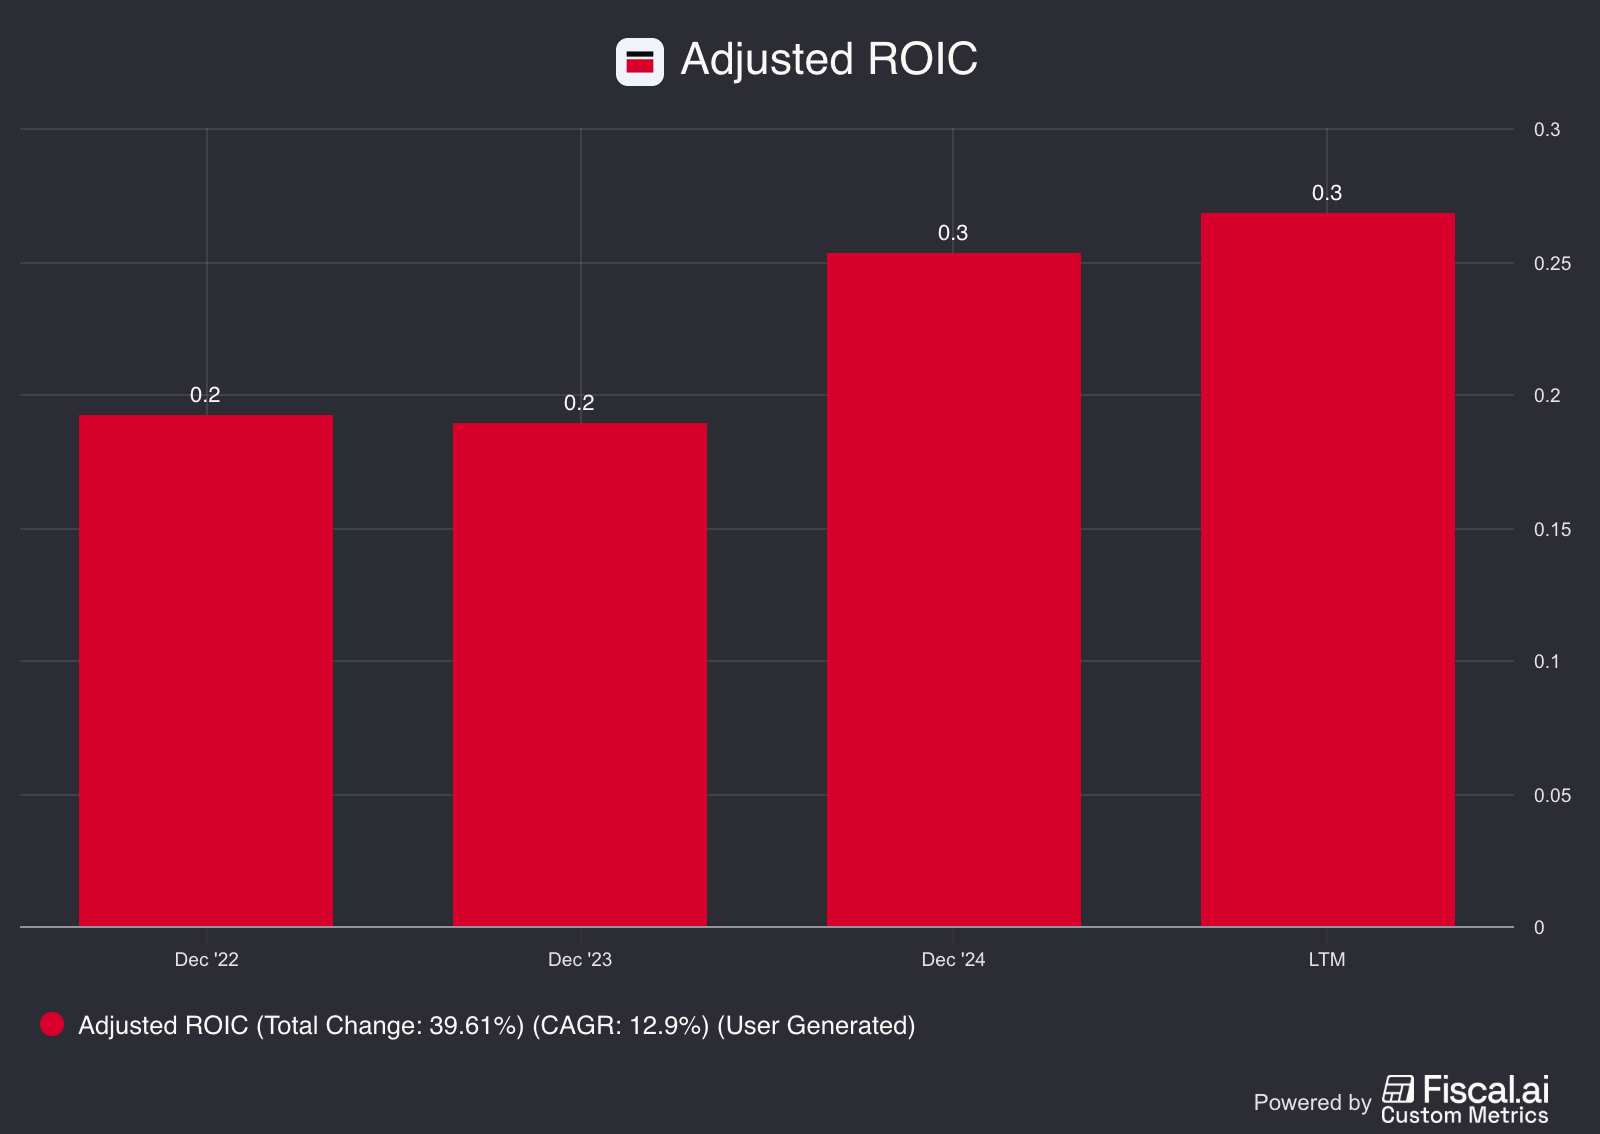
Most analysts now prefer to look at S&P Global’s ROIC by removing the Goodwill and amortization costs for the IHS Markit merger.
When we do that, we see that S&P Global continues to generate attractive returns on their investments.
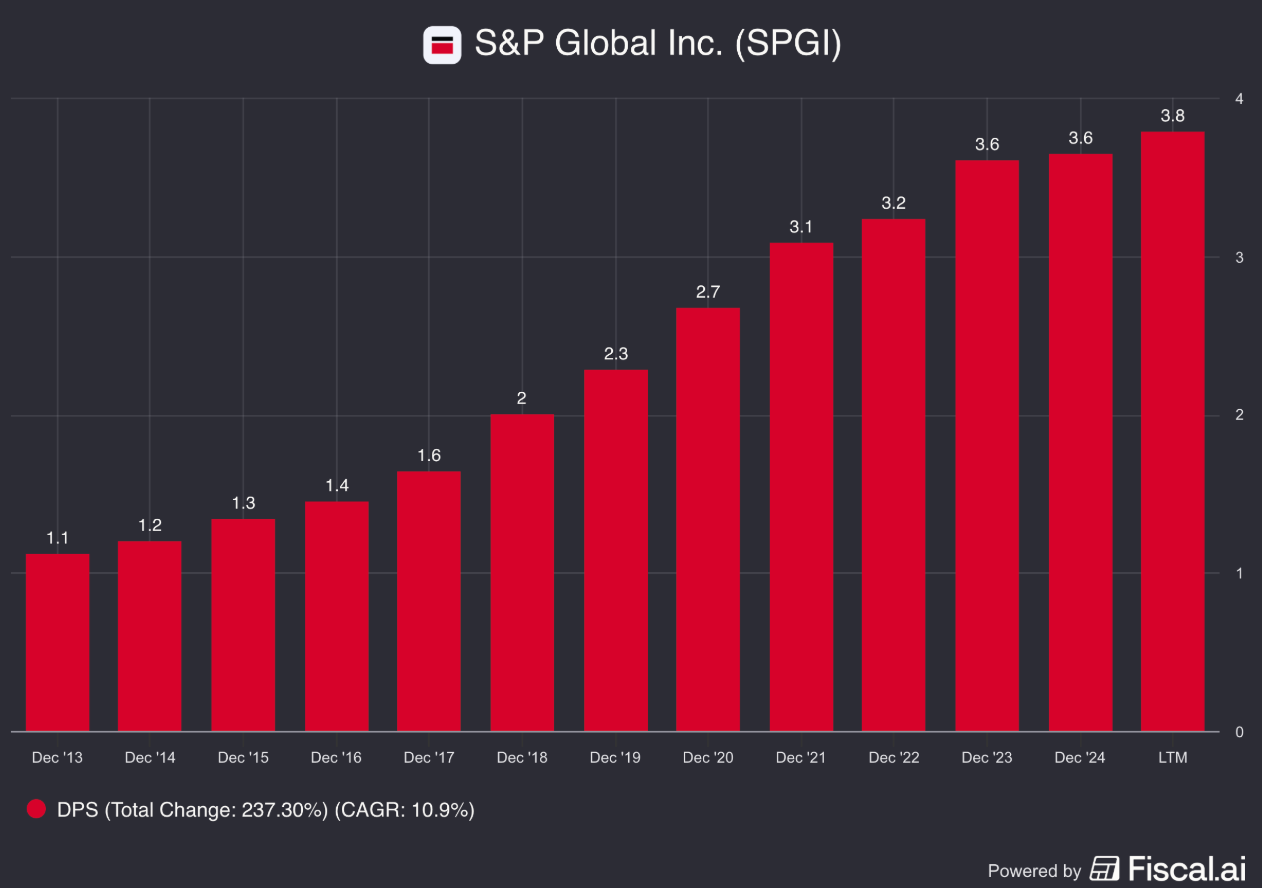
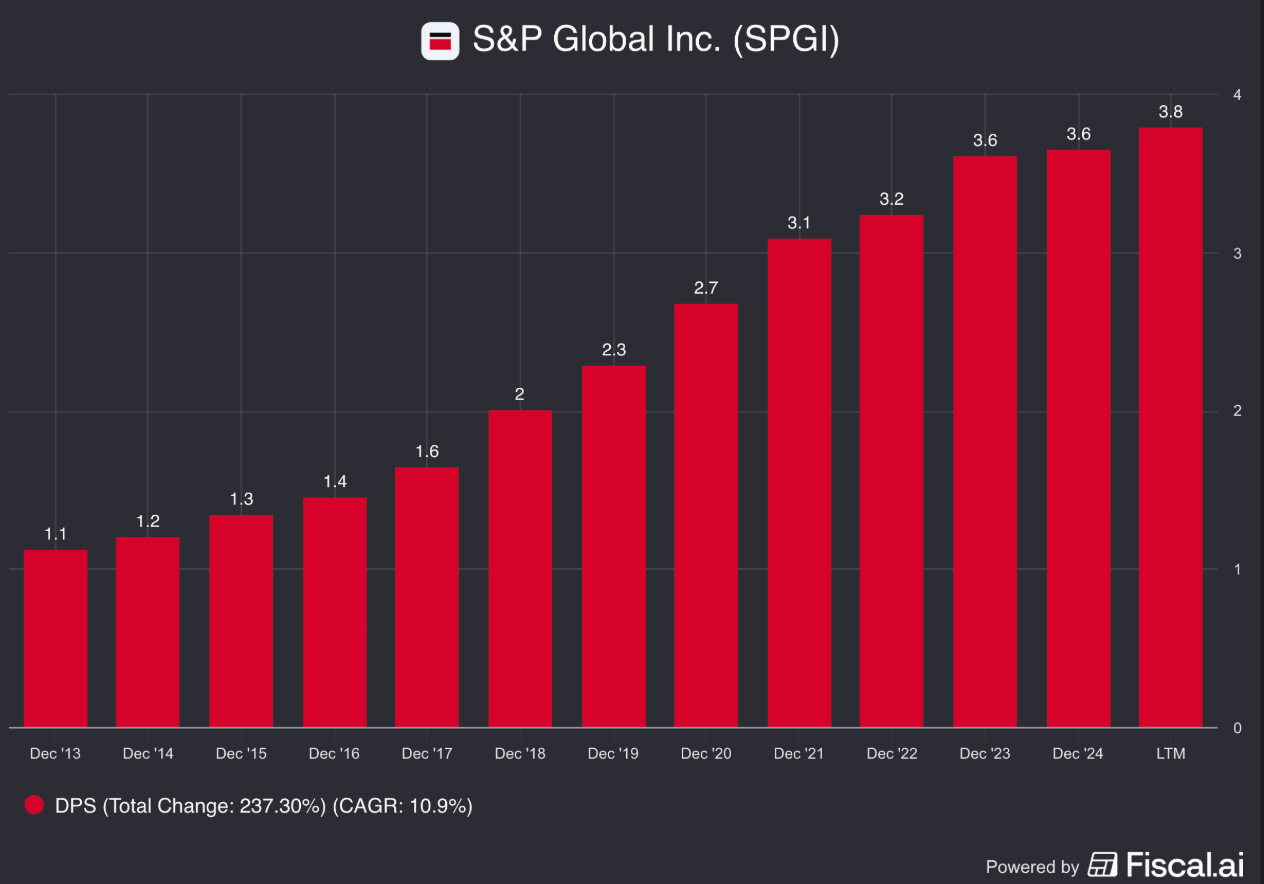
3. Has the company grown the dividend attractively?
You want to invest in companies with a history of growing their dividends.
The higher the dividend growth, the better.
We look for 2 things in the company’s dividend history:
At least 10 years of dividend growth
A 5-year record of growing dividends by 5% or more
S&P Global meets both of these criteria:
Years of Growth: 54 consecutive years (Dividend King).
5-Year CAGR: 8.0%.
4. Is the company active in an attractive end market?
You want to invest in companies that are in stable or growing market.
Here are a few characteristics we look for:
The company sells a necessary product
Recurring sales
A secular tailwind
S&P Global has all 3 of these qualities:
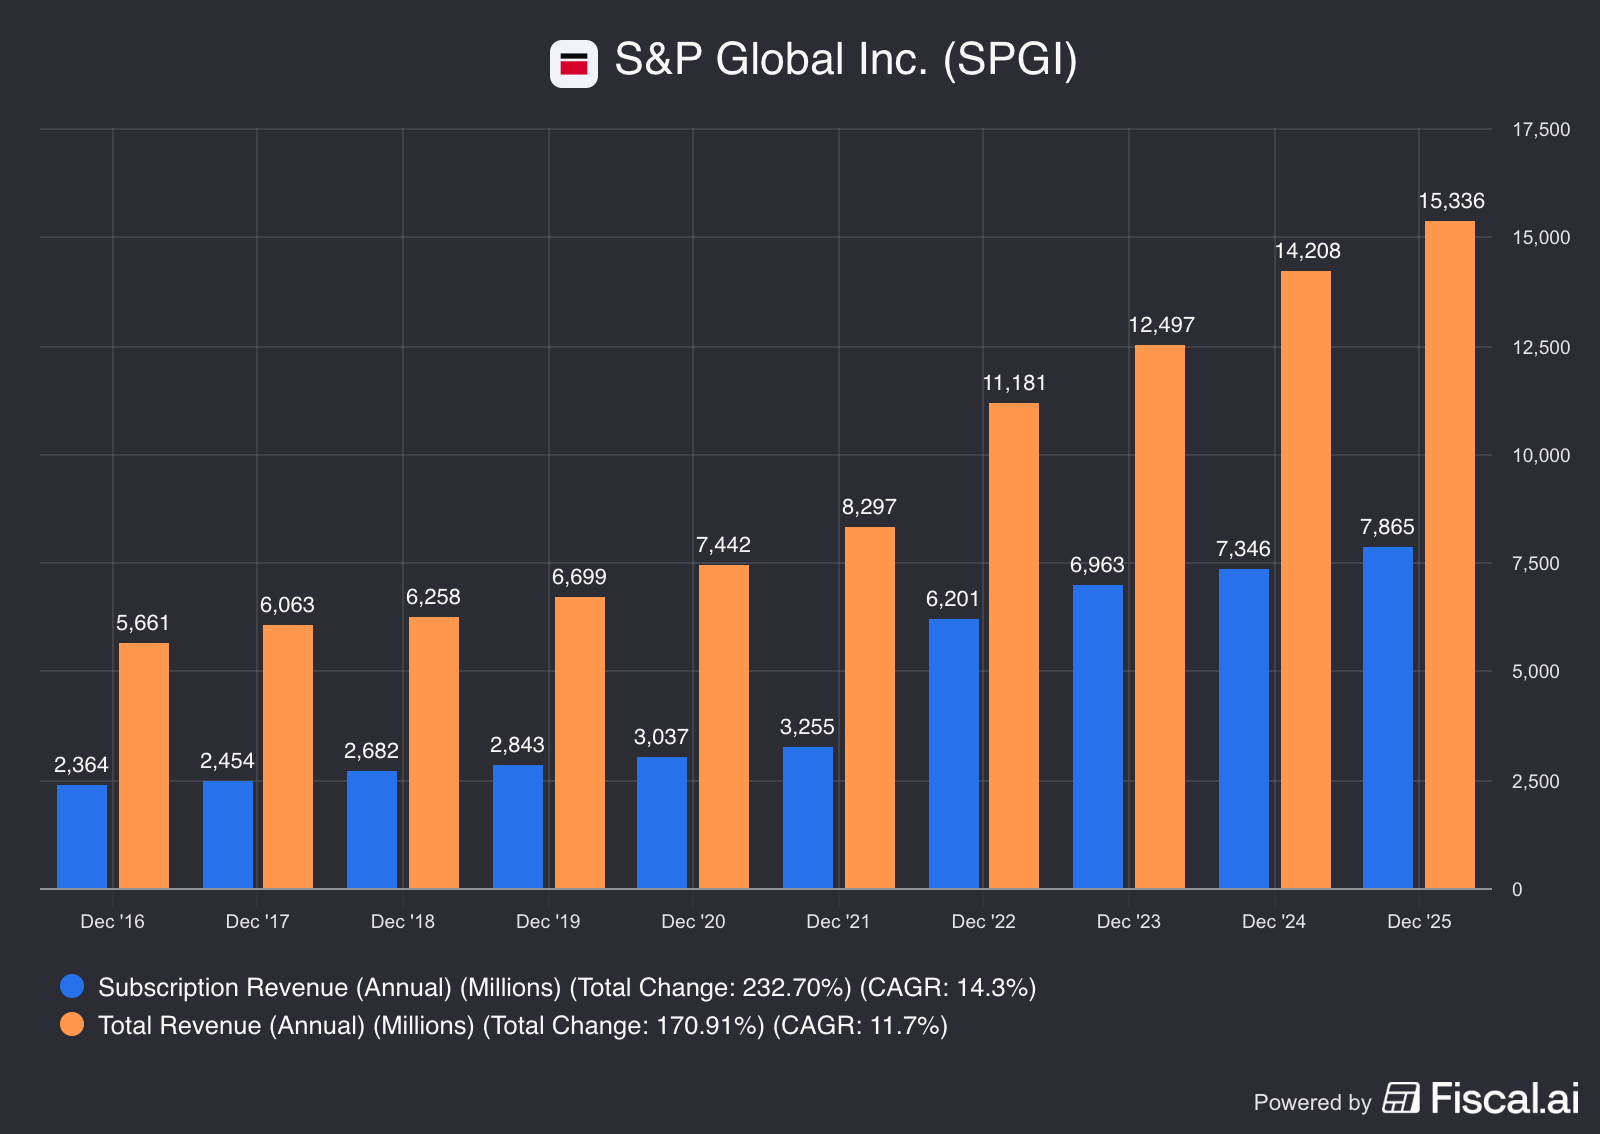
They earn recurring revenue from their subscription data services.
Their credit ratings, and the licenses to their indexes are necessary purchases for many companies.
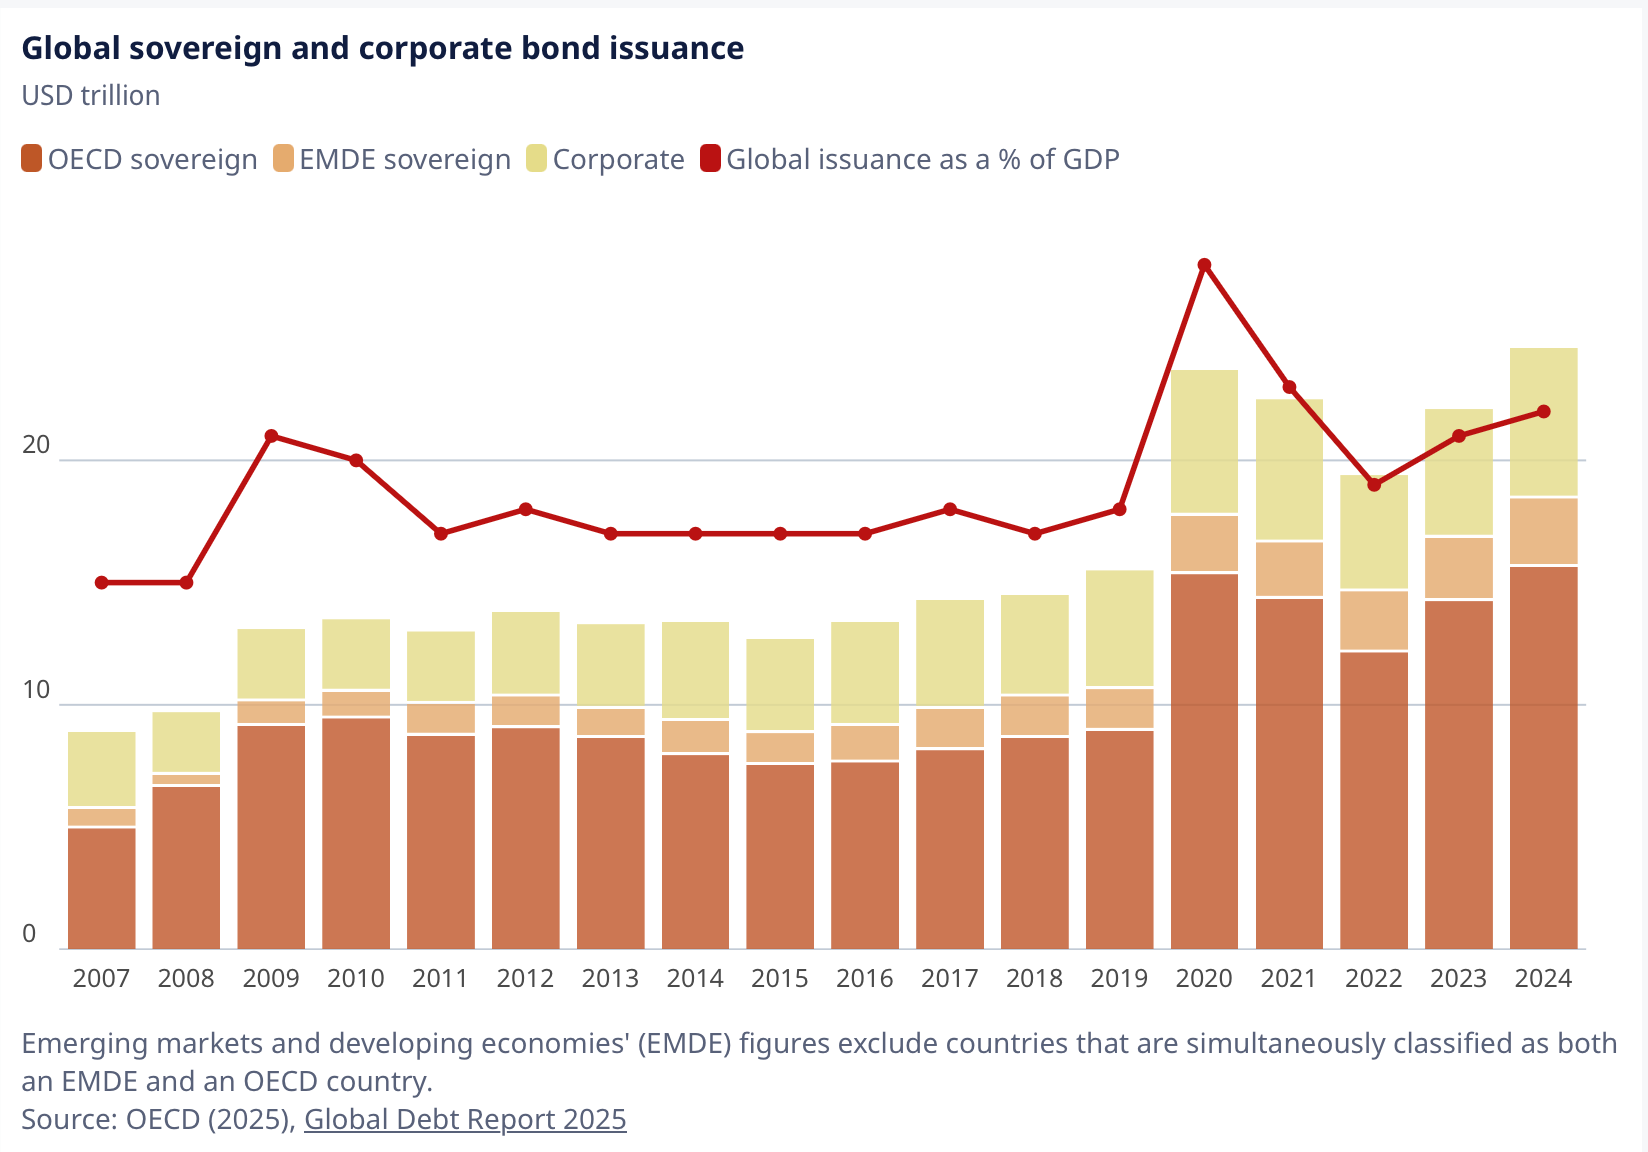
They also have secular tailwinds from the growth of global debt:
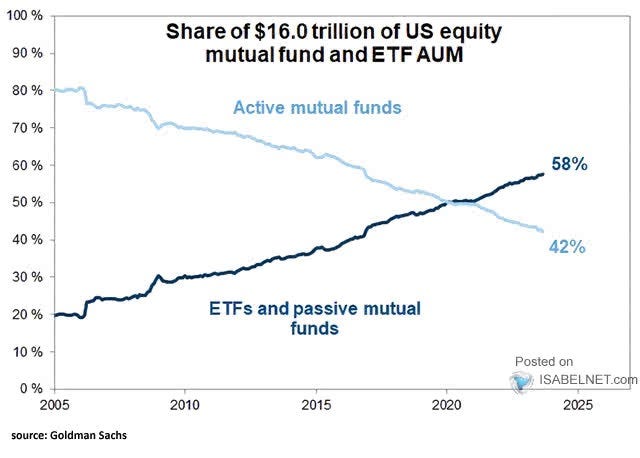
And the ongoing shift towards passive investing:
5. What are the main risks for the company?
Here are the key risks for S&P Global:
Regulatory Scrutiny
Regulators in the US and EU occasionally target the Big Three rating agencies, threatening to open up competition or cap fees.
Mitigation: S&P Global’s brand and historical data are so deeply embedded in global regulations that replacing them would almost impossible
Issuance Volatility
If interest rates spike or a recession hits, companies stop issuing new debt. This can cause the Ratings revenue to drop temporarily.
Mitigation: 51% of S&P Global’s total revenue is now subscription-based (Market Intelligence, Indices, Mobility), which provides a stable base for the more volatile debt issuance
Execution Risk (IHS Markit)
Merging two giants is hard. If they fail investors might punish the stock.
Mitigation: Management has a history of successful integration (SNL Financial, Kensho) and has already achieved most of the cost-cutting targets ahead of schedule
AI Disruption
The market is worried that AI will replace financial analysts and reduce the need for S&P’s services.
Mitigation: S&P is building its own AI (Kensho) to make its data more valuable. In addition, they own the proprietary data that AI needs to be accurate, making them very hard to replace.
Now let’s dive into the most important part: the Fundamentals.
Want the rest of the investment case?
Curious to find out if S&P Global earns a spot in the Compounding Dividends Portfolio?
You can join us here:
One Dividend At A Time
-TJ
Used sources
Interactive Brokers: Portfolio data and executing all transactions
Fiscal.ai: Financial data
Disclaimer
As a reader of Compounding Dividends, you agree with our disclaimer. You can read the full disclaimer here.
Why are Papa John’s and Yum Brands listed as peers in the one sheet?
The Middle East is moving fast—risk, but also opportunity.
Even if the S&P falls, Japan may not follow.
I share my view below.
I write detailed analysis on Japanese stocks 🇯🇵
Followed & subscribed—let’s connect 🙌