

I’ve always thought that spending too much time on macroeconomics is a waste of time and energy.
It’s too complex and there are too many moving parts.
Trying to predict inflation, what the Fed will do at their next meeting, or where the S&P 500 will close out the year is usually a fool’s errand.

It’s almost always better to spend you time looking at businesses, and understanding the moat, the cash flows, and how management allocates that capital.
Notice that I said almost always.
Every once in a while, things have shifted around enough that it’s worth taking a look at the macro.
I think we’re at one of those points right now.
There are big trends and shifts happening under the surface of the headline indices that I think will be important for returns going forward.
I’ve been thinking about them quite a bit, so I think it’s worth me writing some articles about them.
It will help me clarify my own thinking and it will help you understand where I’m coming from.
To be clear, I’m not about to make any predictions, or tell you what’s going to happen.
As Howard Marks says:
“We may never know where we’re going, or when the tide will turn, but we had better have a good idea where we are.”
Over the next few articles, we are going to figure out exactly where we are.
And to do that, we have to start by looking away from Wall Street, and paying attention to what the actual consumer is doing on Main Street.
Let’s start broad.
Before the pandemic, consumers were saving somewhere between 5% and 8% of their income.
Consumer loan balances rose from $720 Billion to $850 Billion over about 3 years.
That’s about 5.7% growth per year.
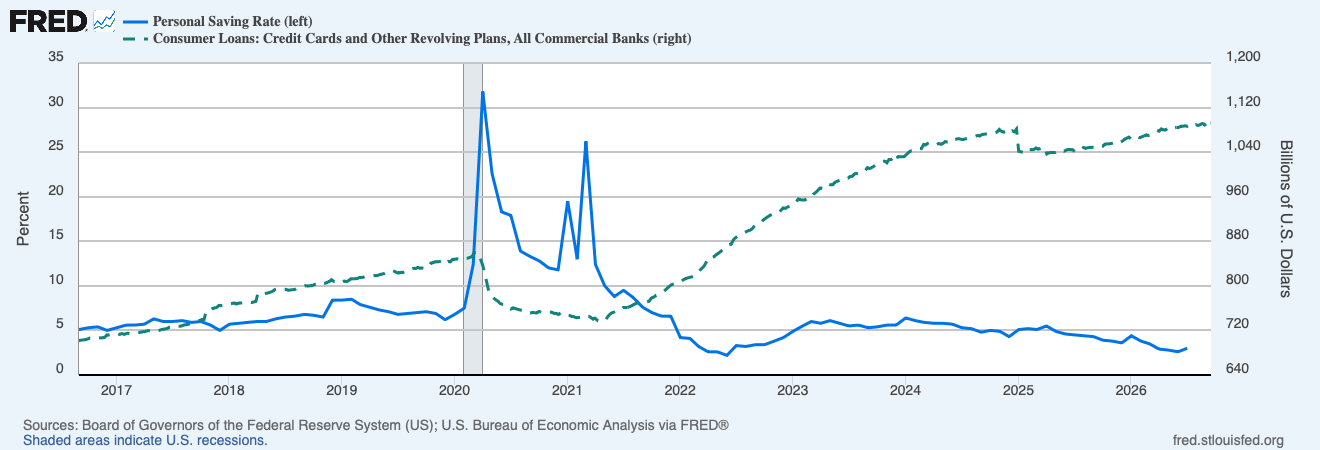
Since the pandemic, savings rates have barely gone above 5% and are now at 3%.
Loan balances were back at about $800 billion in 2022 and are now about $1.1 trillion.
That’s about an 8.3% growth per year.
So consumers are saving less and borrowing more.
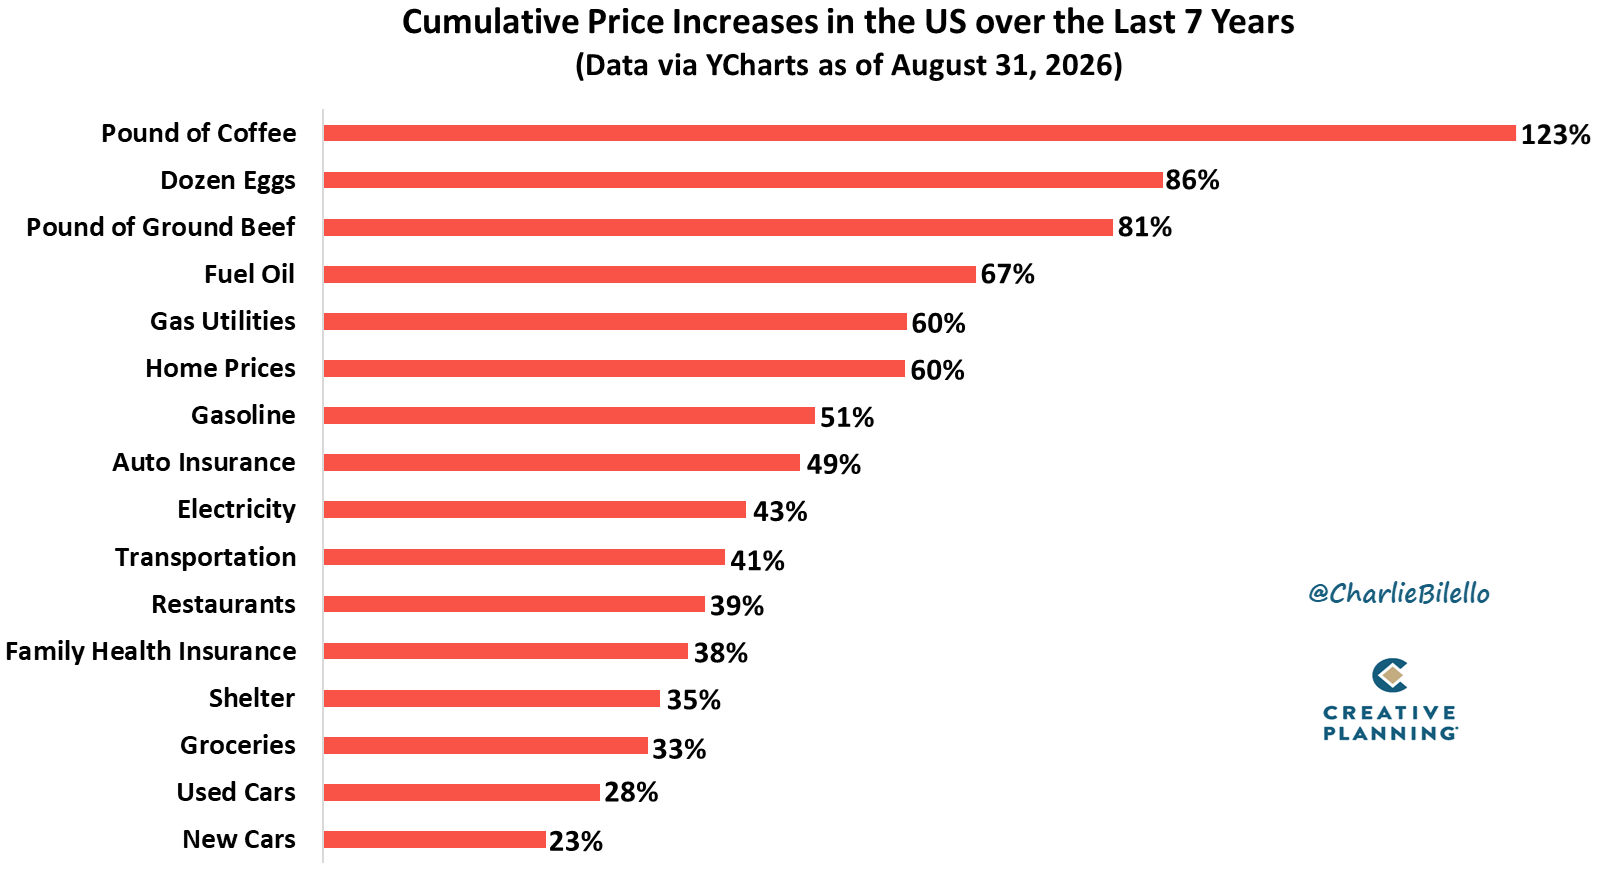
Clearly inflation is an issue.
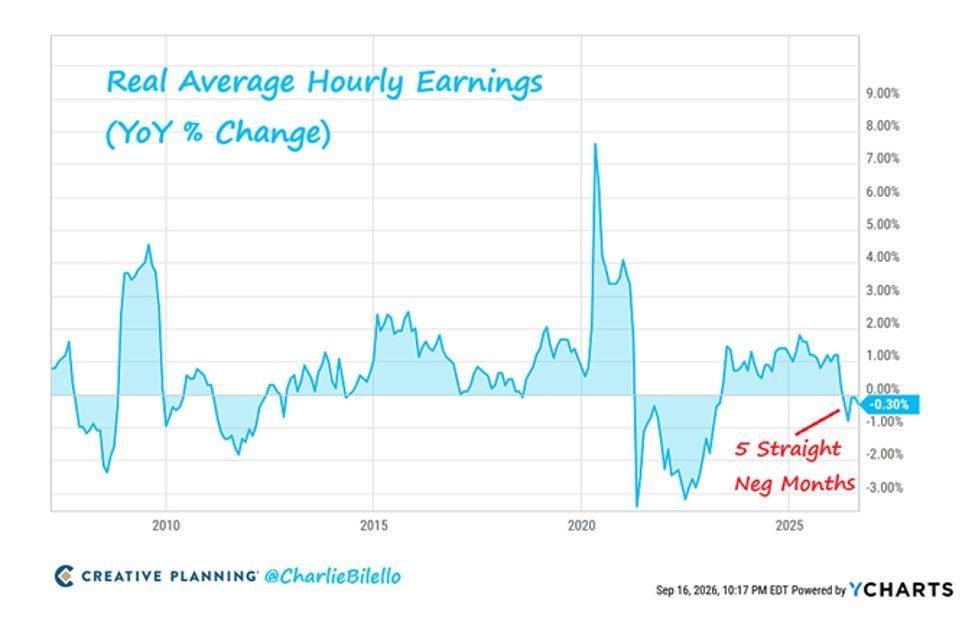
Wages haven’t kept up.
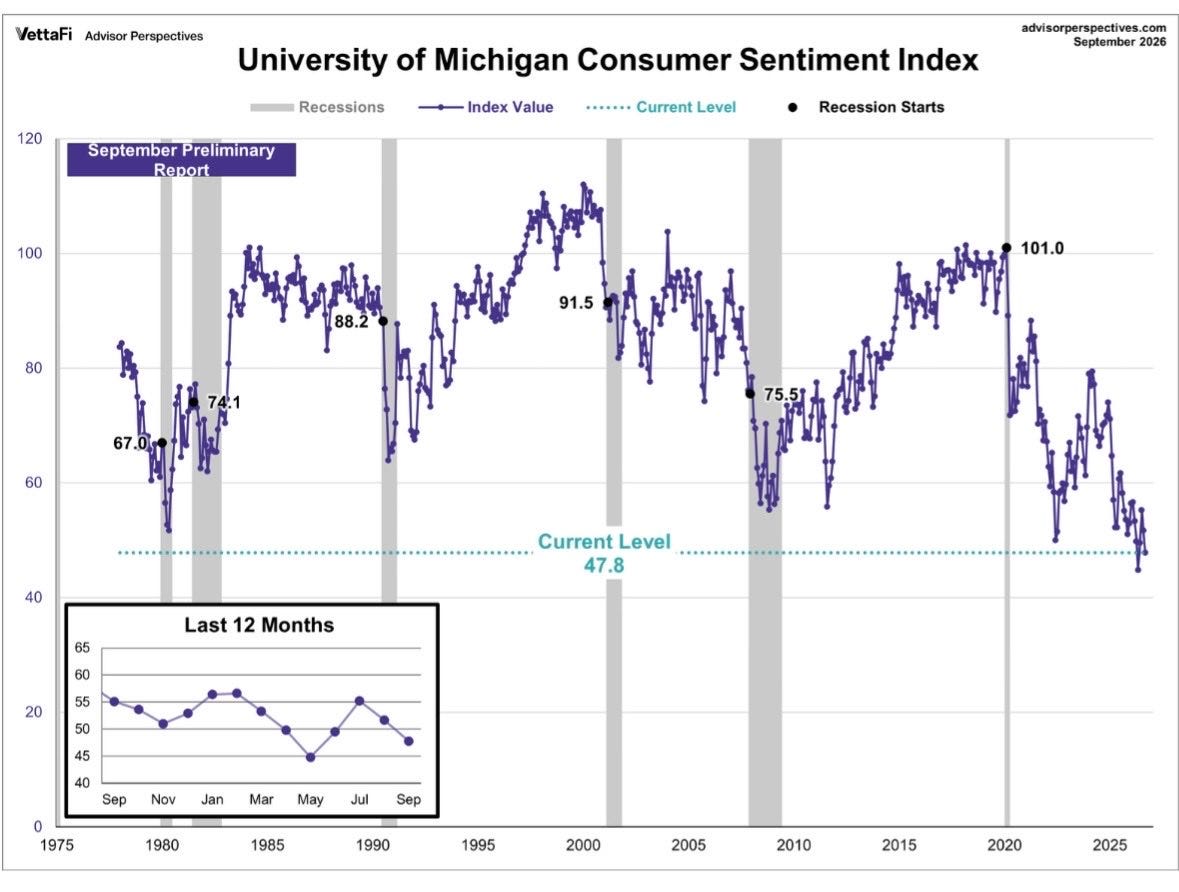
They don’t feel good about it.
The narrative is that the economy is K-shaped.
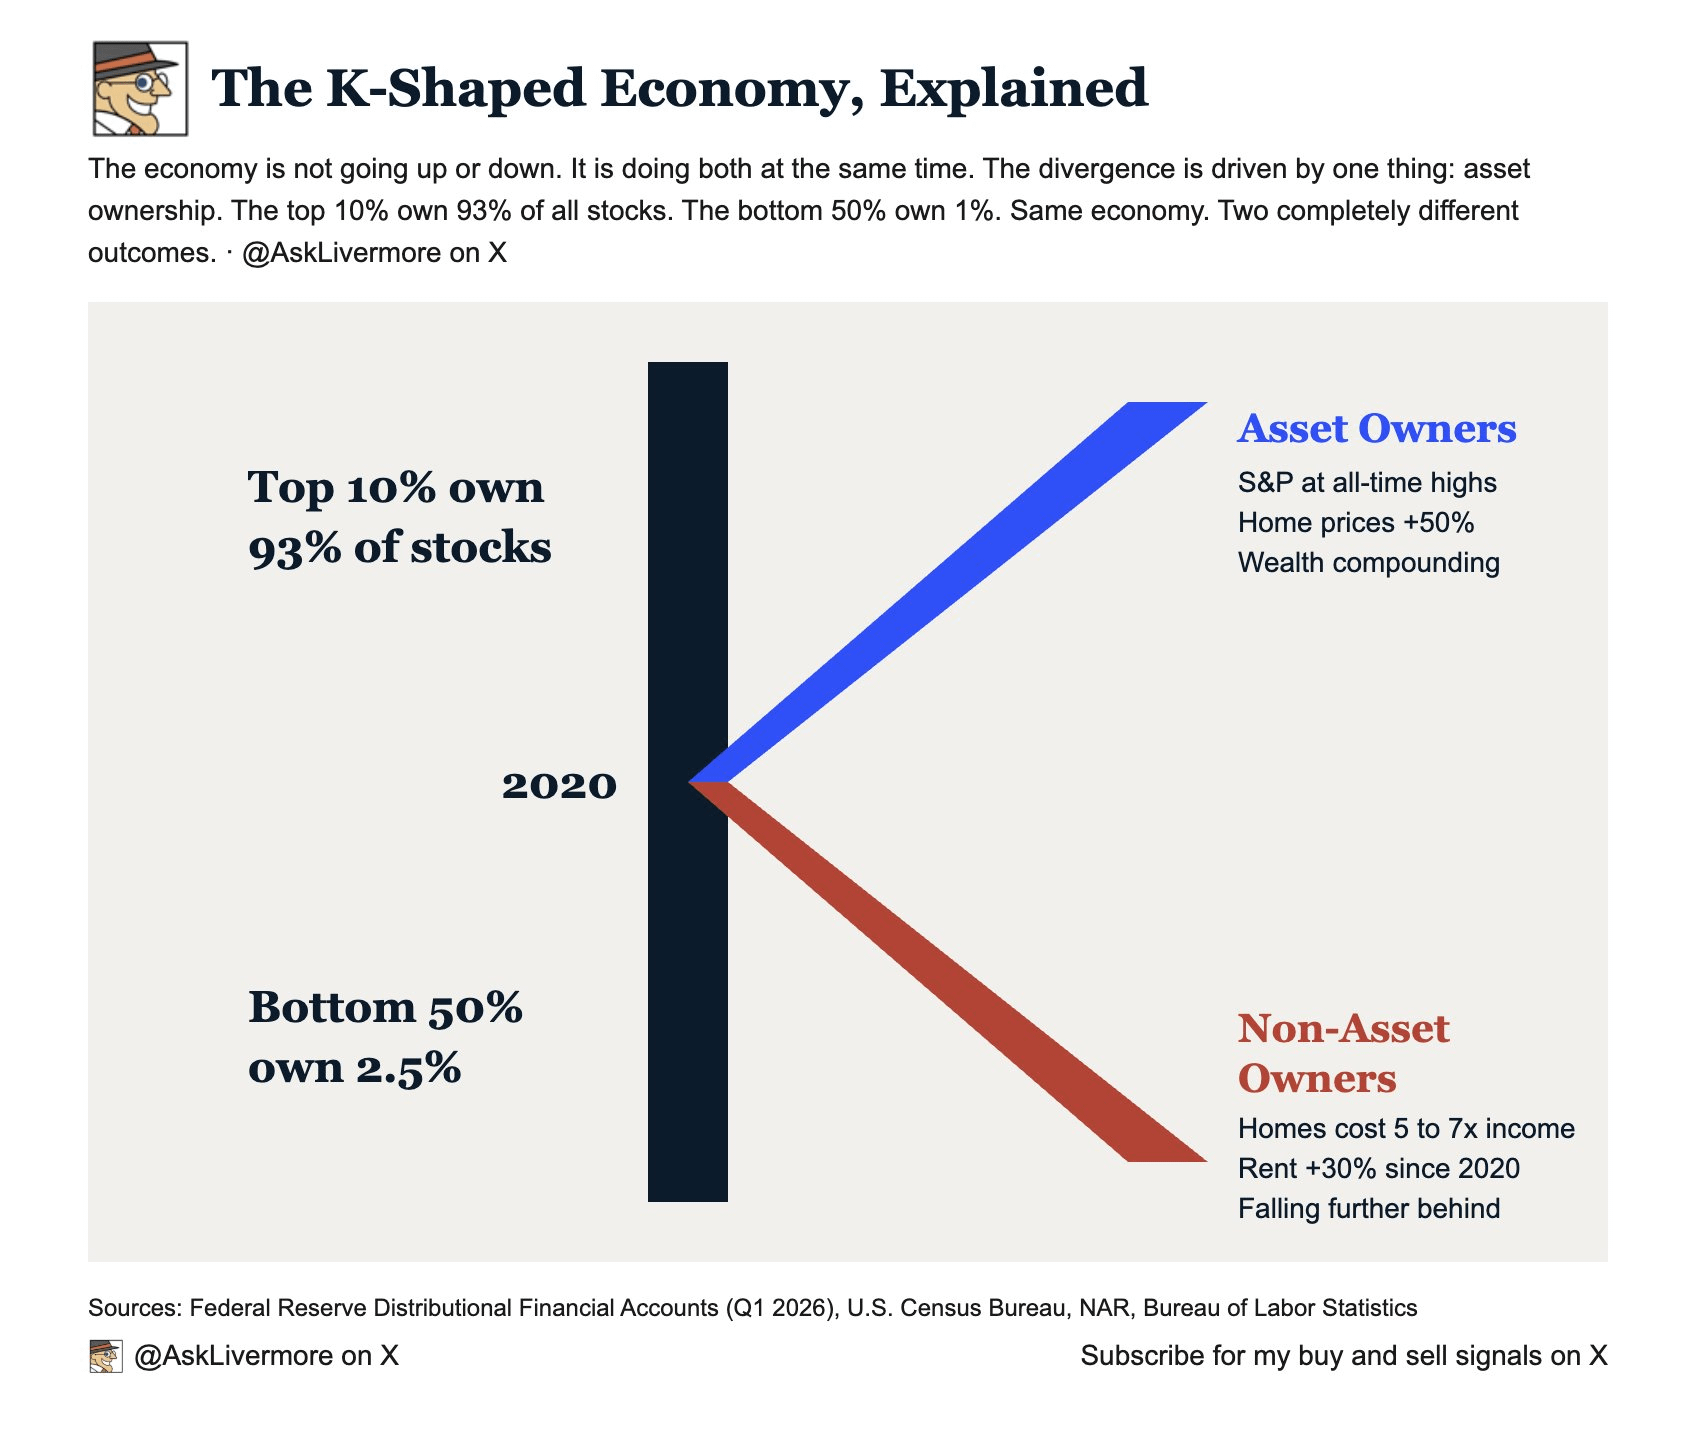
That means that the economy splits into two parts, with one part improving, and the other declining.
The Upper Arm Improves: This includes wealthier households, asset owners, and high-margin or tech-driven industries, their investments, home equity, and wages rise, improving their situations
The Lower Arm Gets Worse: Lower-income workers, service employees, and blue-collar households fall further behind, because of wage stagnation, inflation, depleted savings, and rising debt
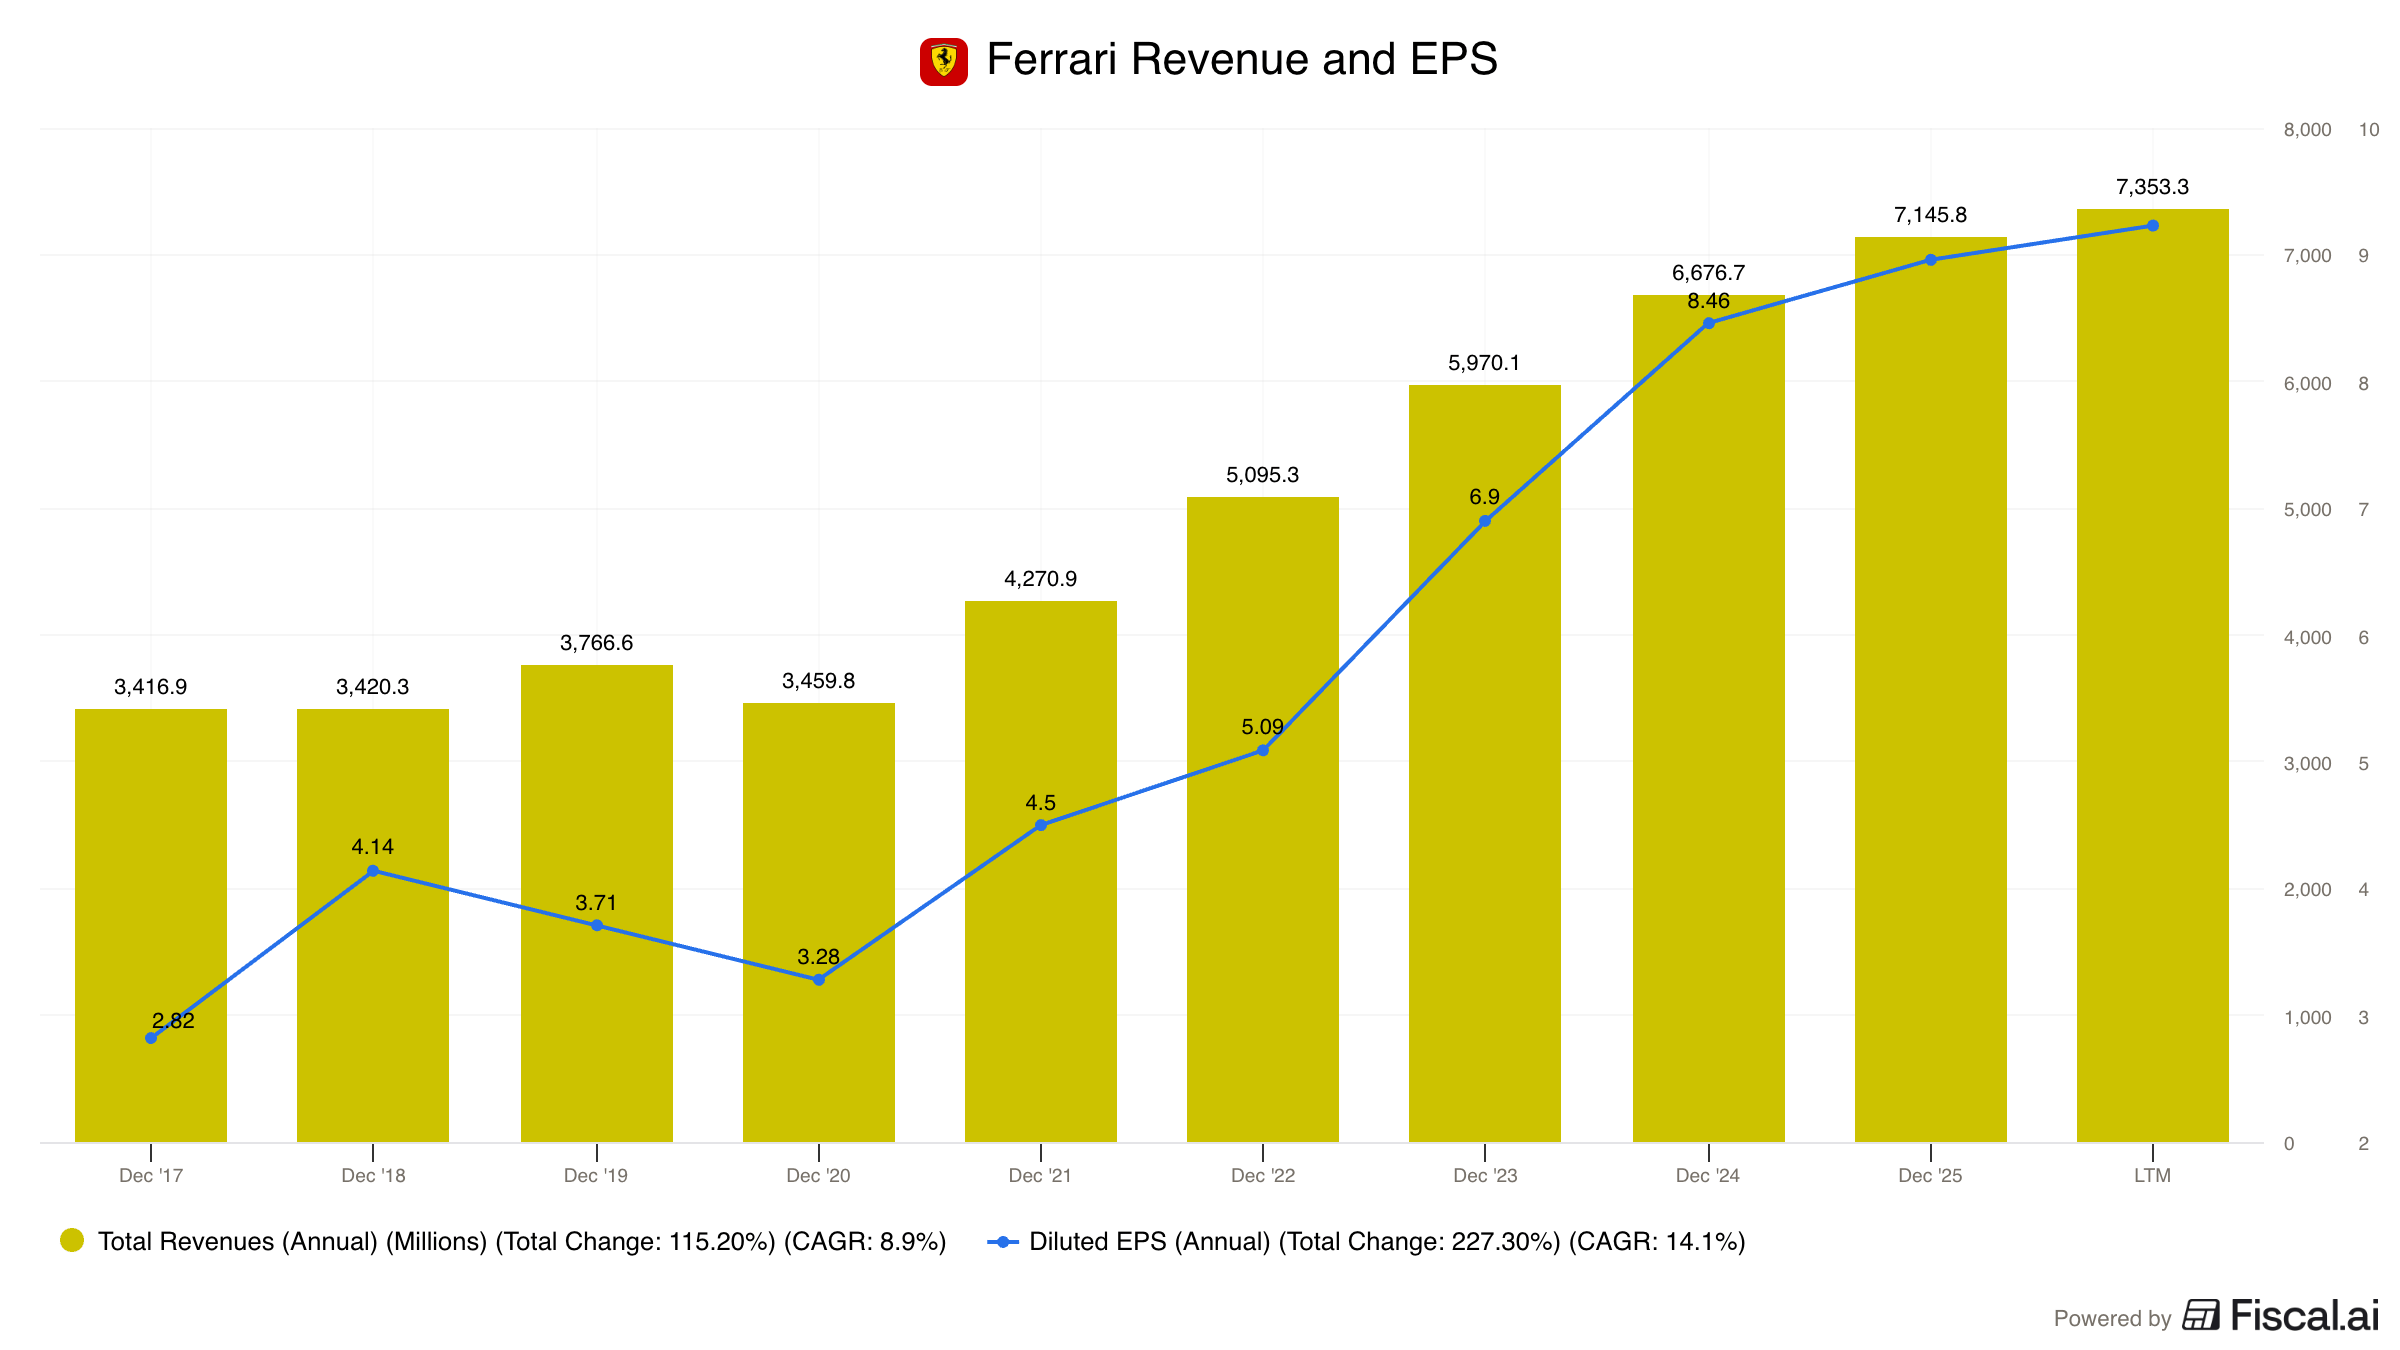
That’s been true, with companies like Ferrari growing strongly:
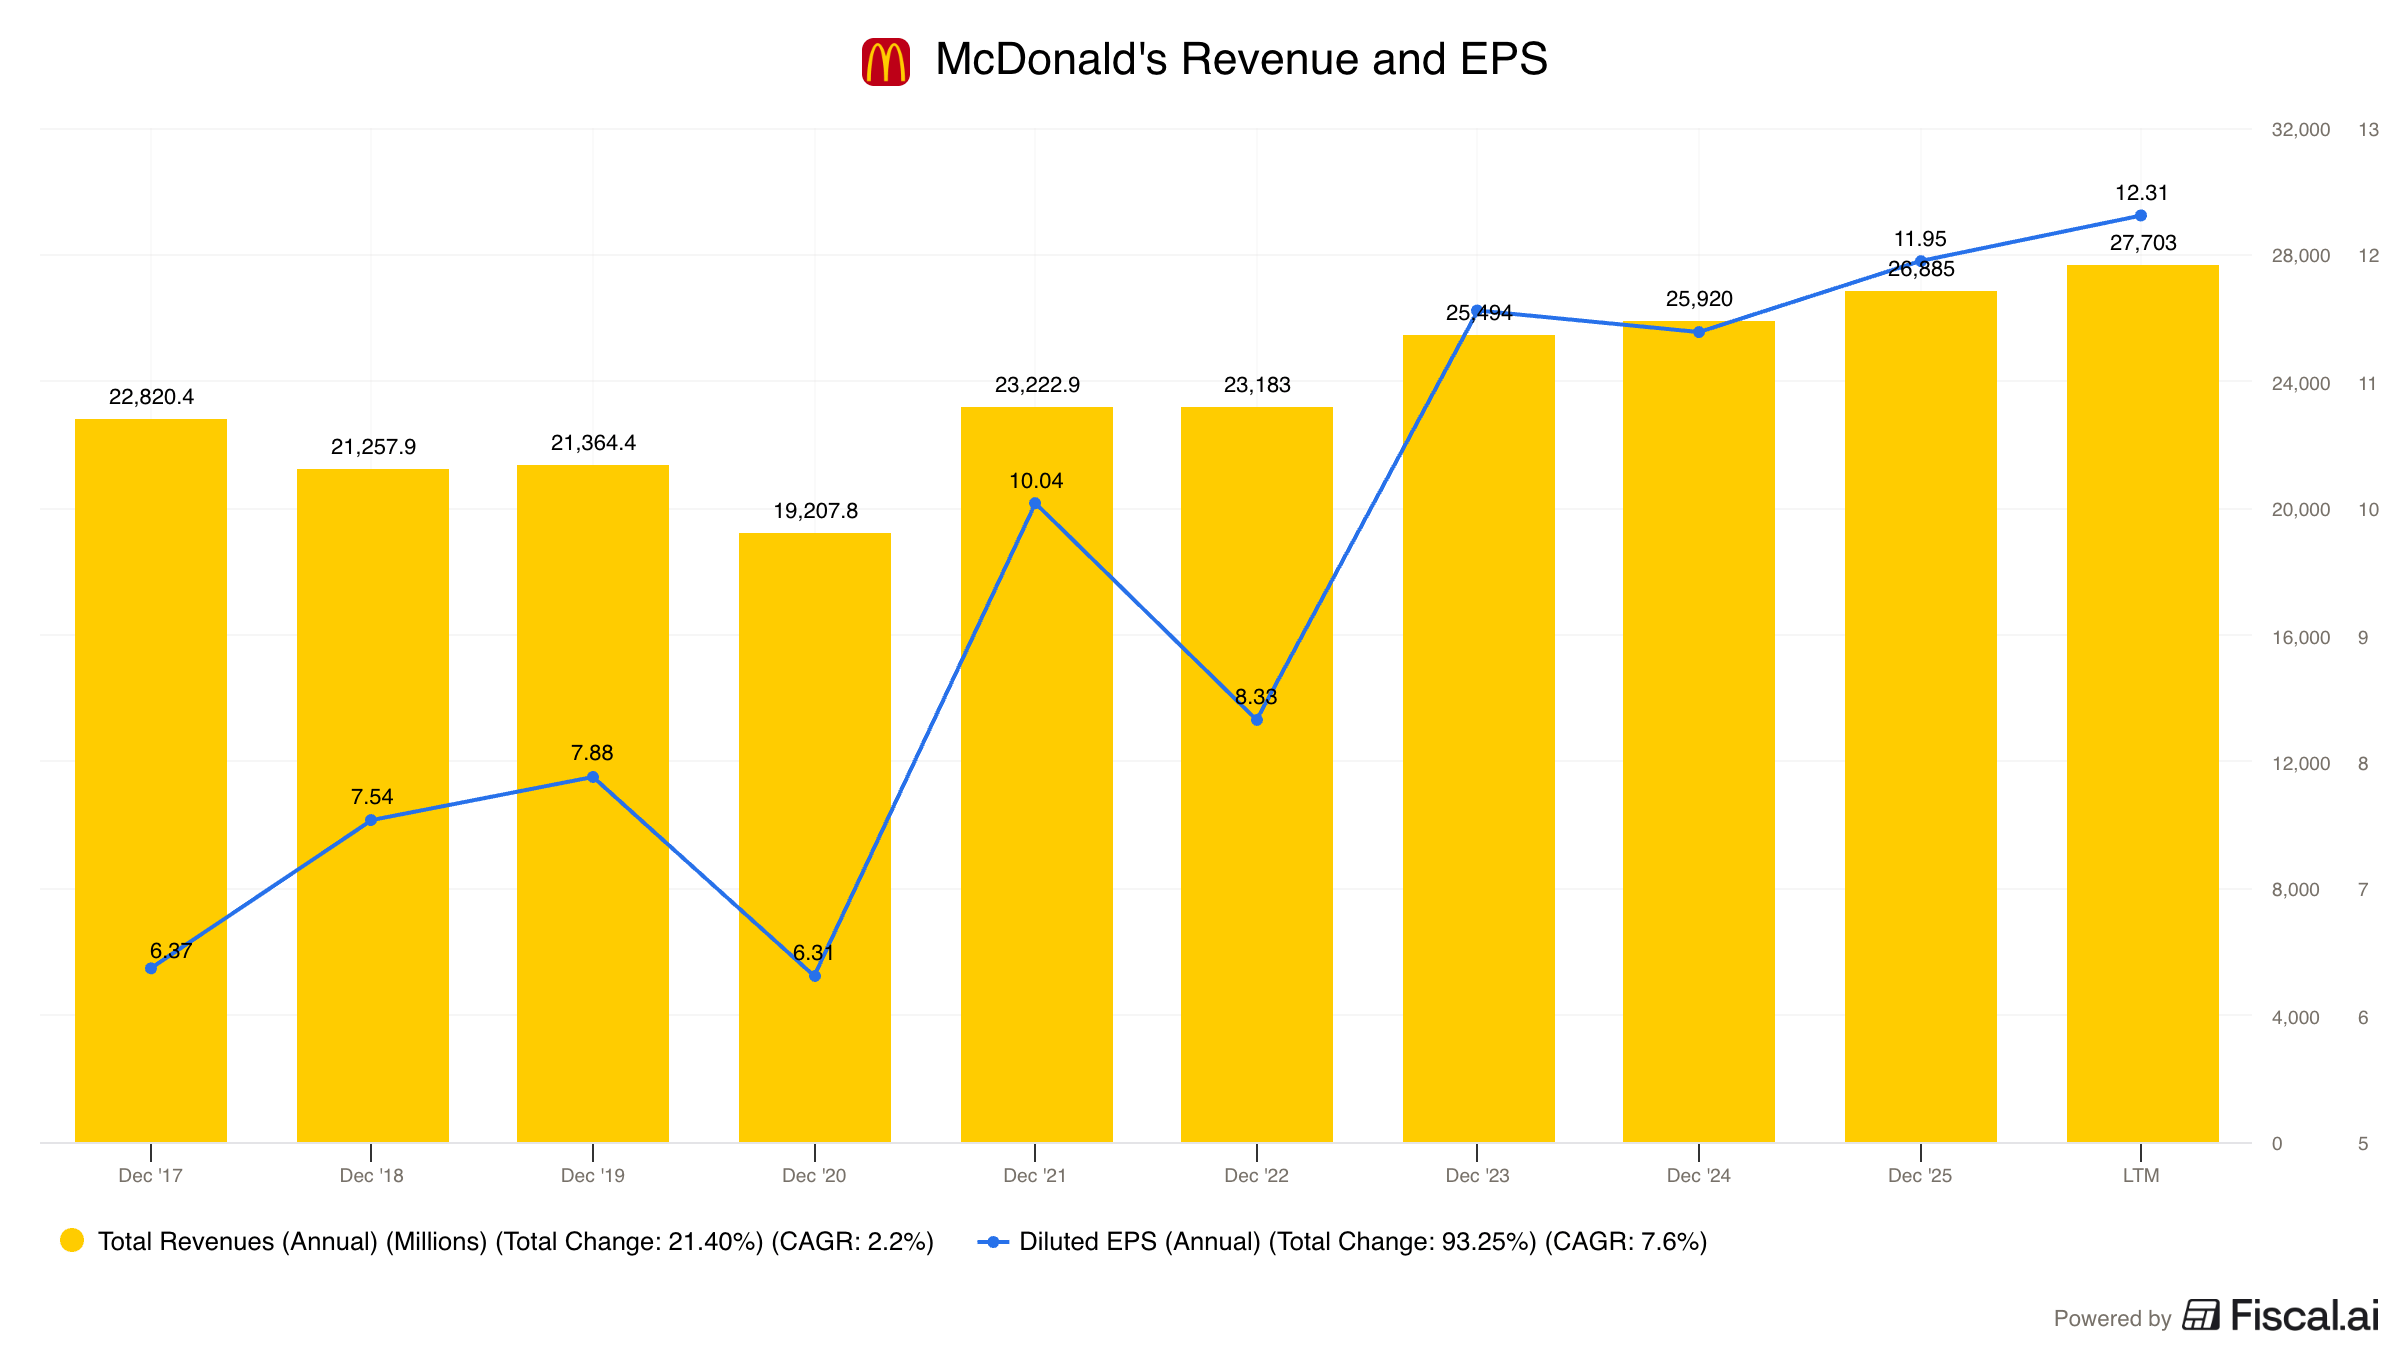
While companies that cater to lower-income consumers like McDonald’s struggling to grow:
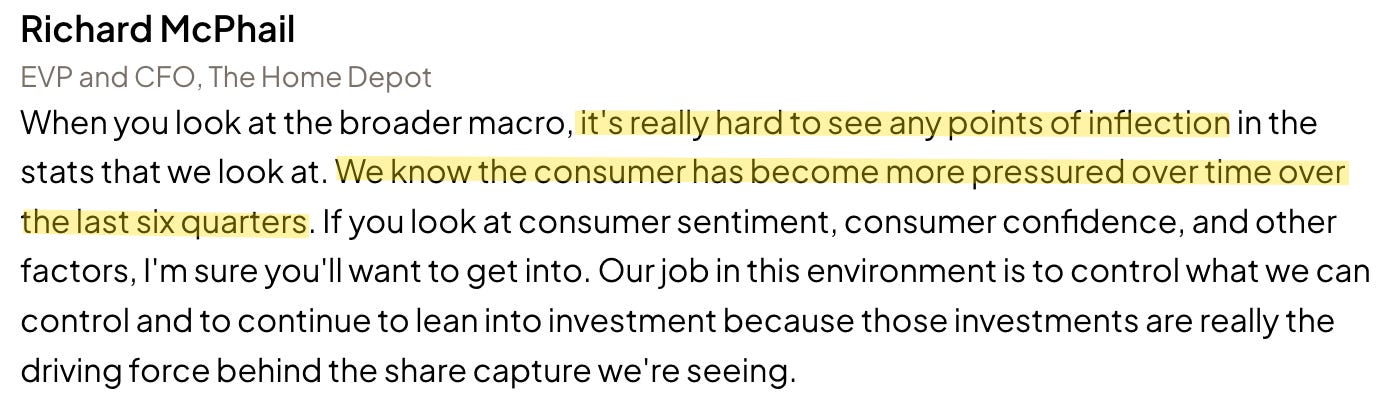
But companies are seeing warning signs that the pressure on consumers is moving up the income distribution.
Home Depot’s CFO Richard McPhail said that consumers are more pressured, and that there’s no signs of it improving.
People who shop at Home Depot either own a home, or have been renting where they live long enough to be willing to put some work into it.
The median household income for Home Depot customers is around $80,000, well above the national median of $68,000.
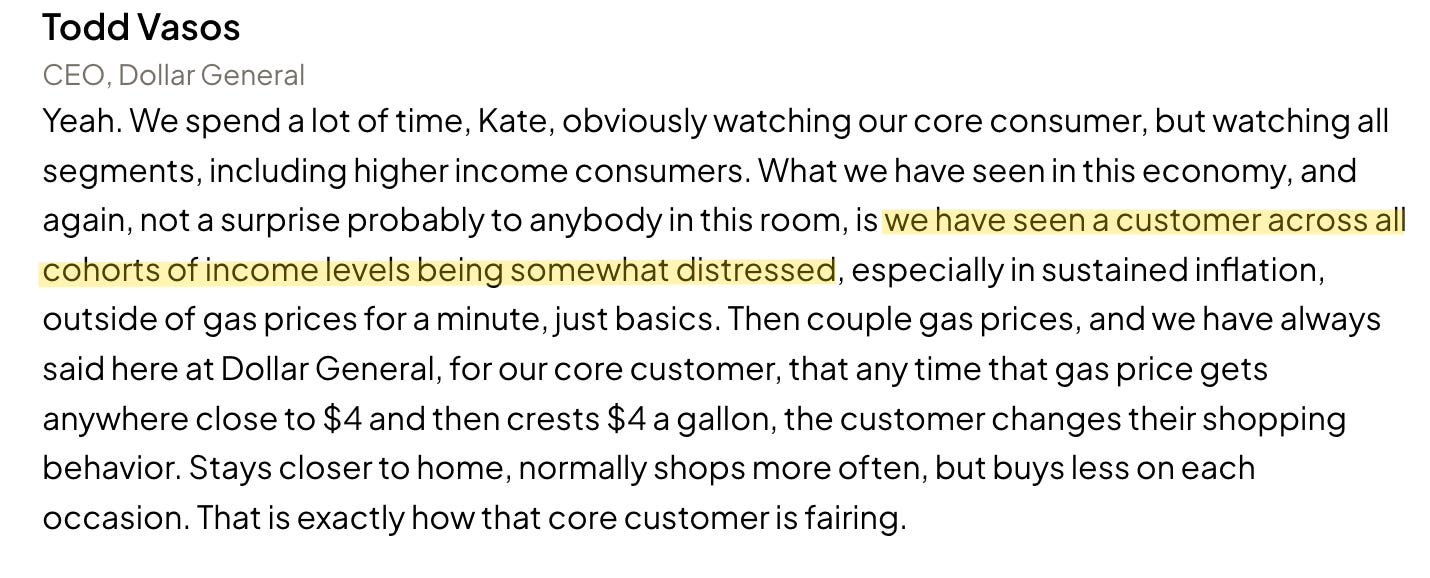
Dollar General is also seeing pressure on higher income consumers:
Here’s some quotes from Dollar General’s most recent call.
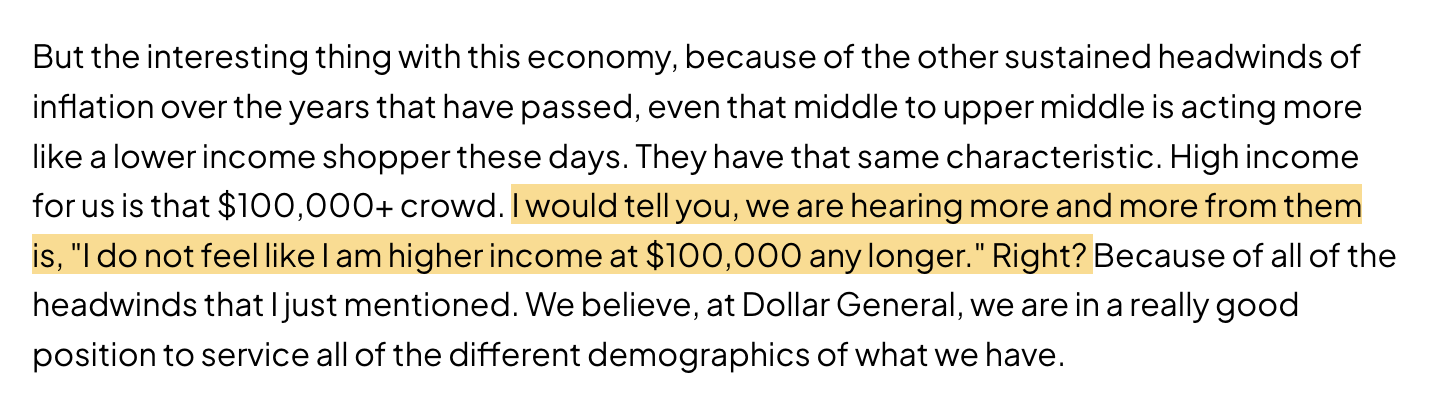
So it seems that the pressure is moving up the income chain.
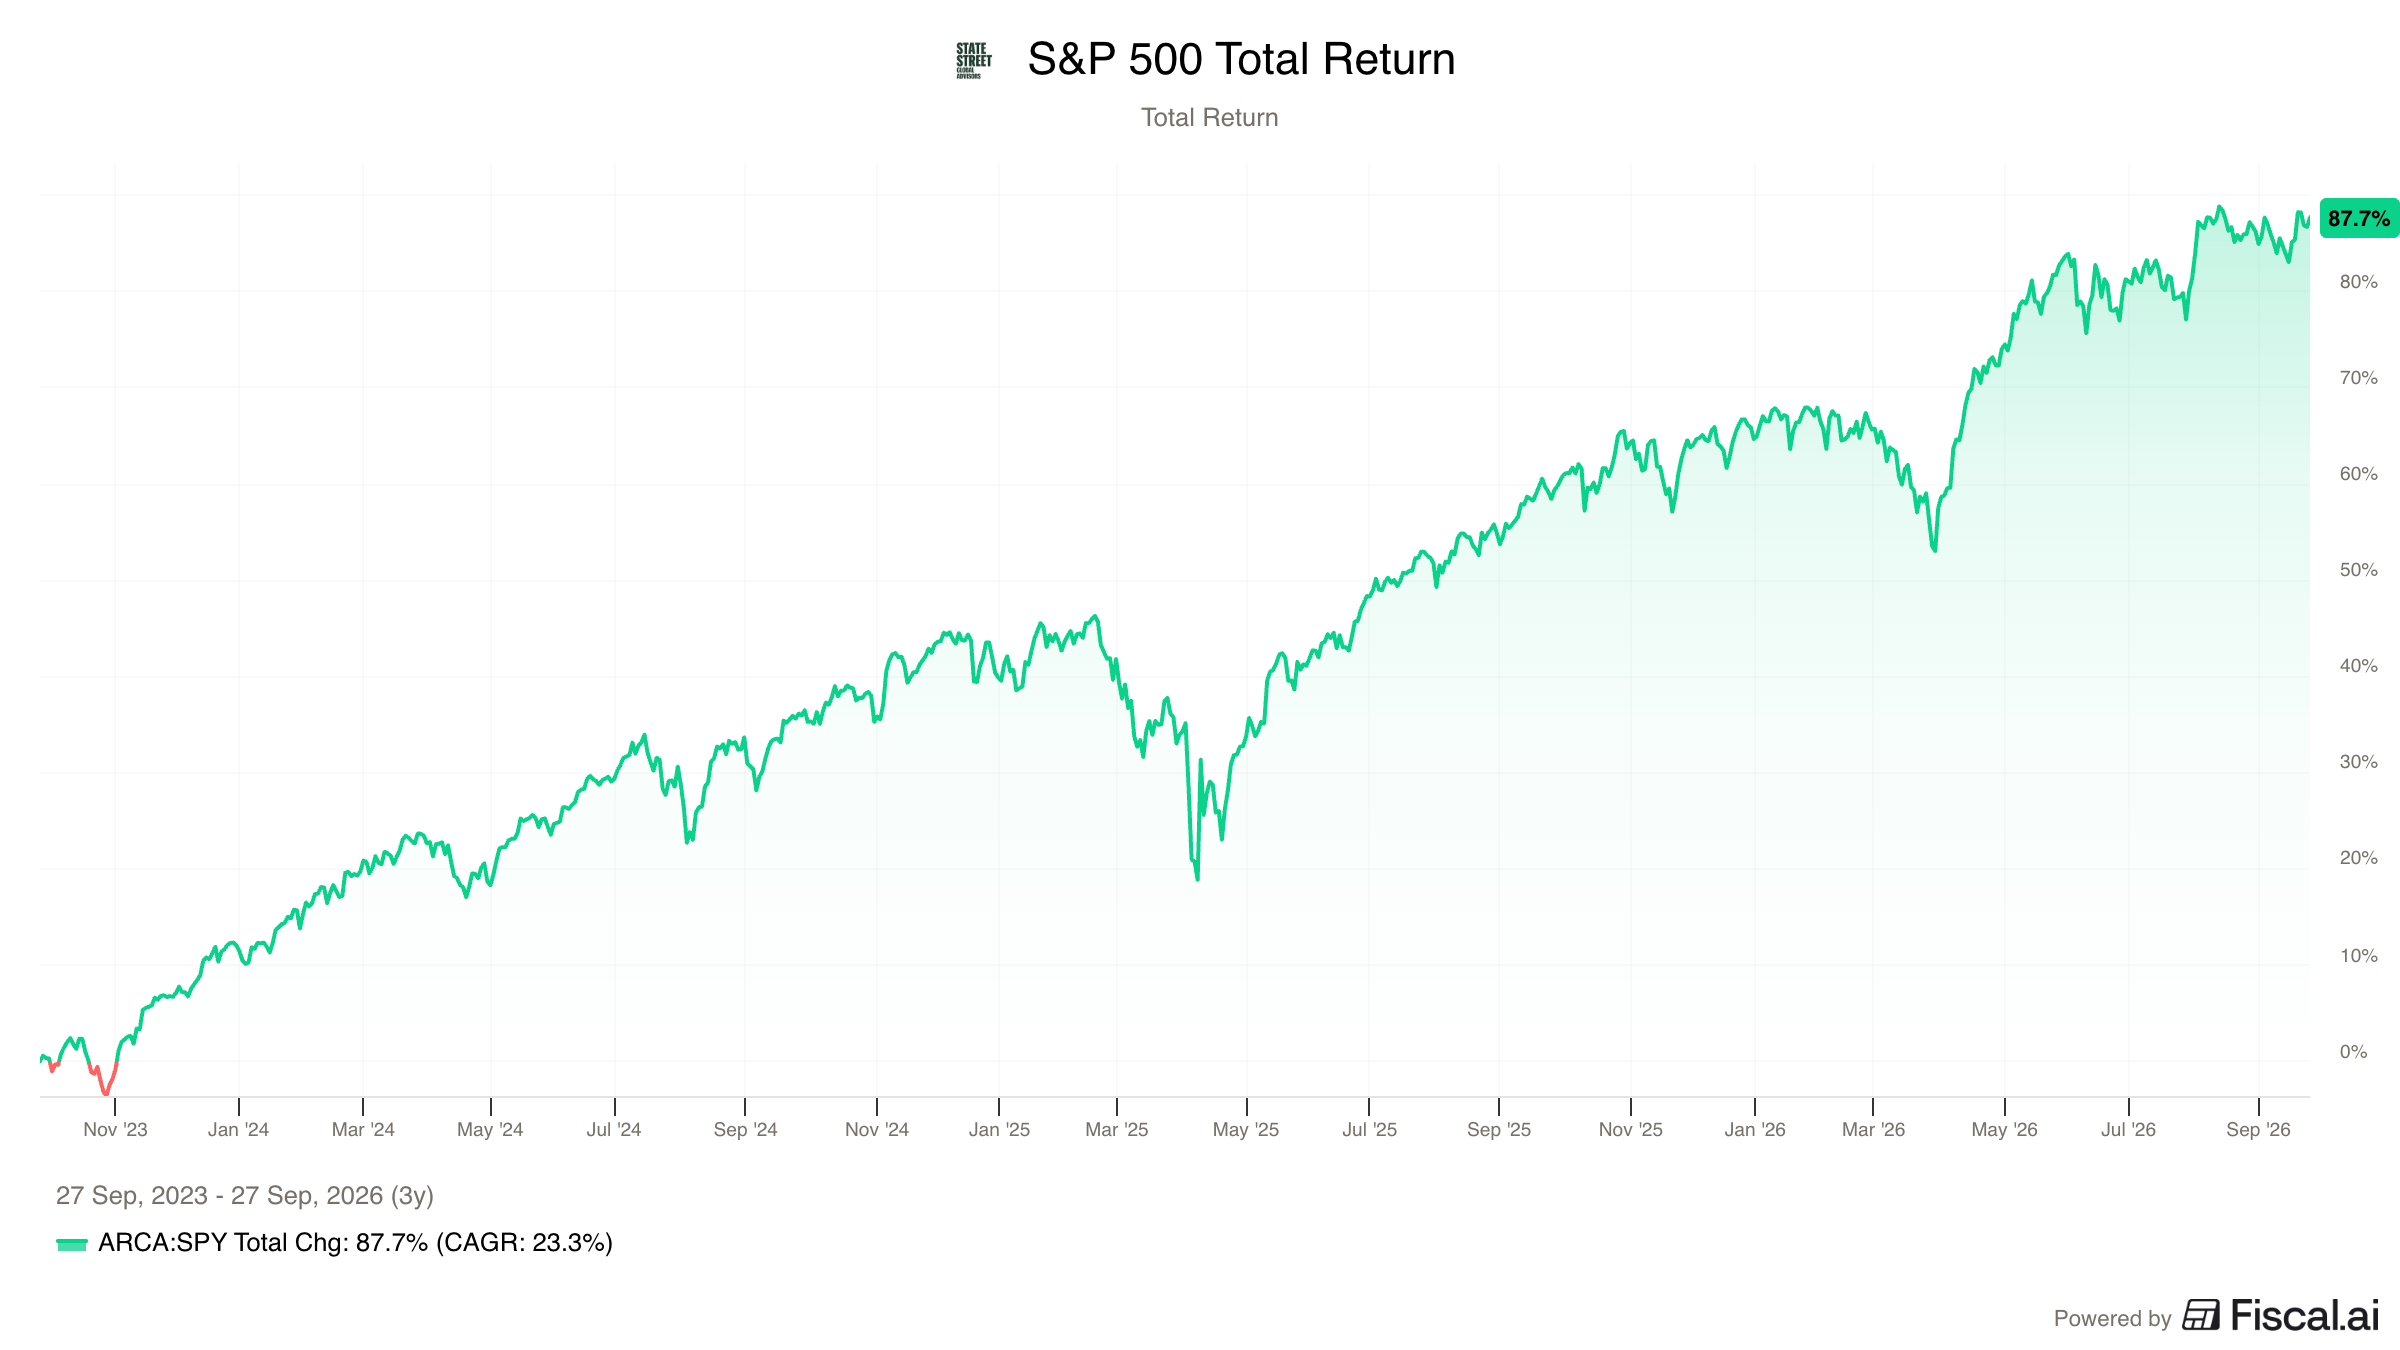
But you wouldn’t know it from looking at indices like the S&P 500.
It’s got a total return of almost 88% over the past three years.
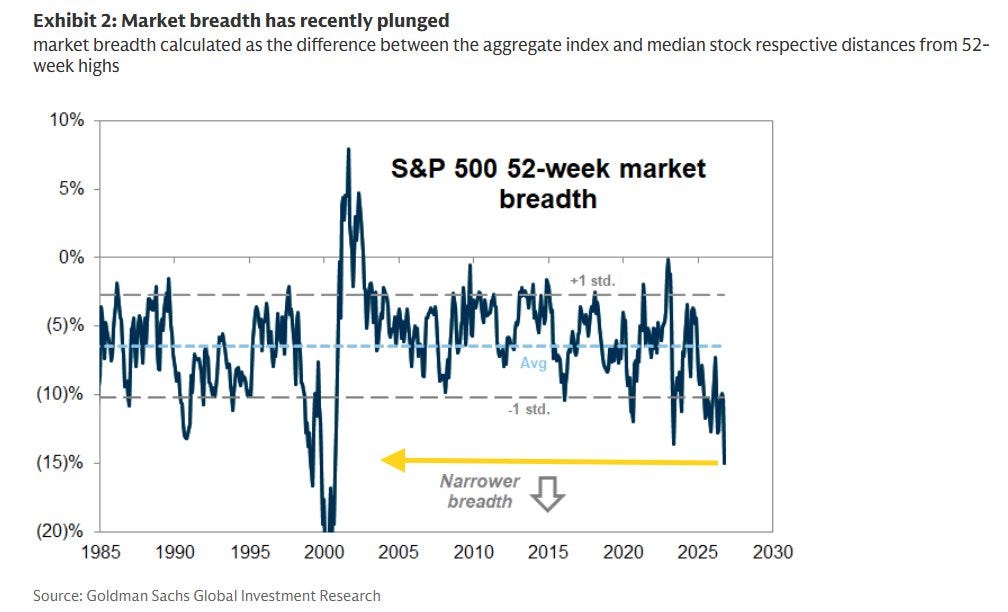
Under the surface, the index is being pushed up by fewer and fewer stocks.
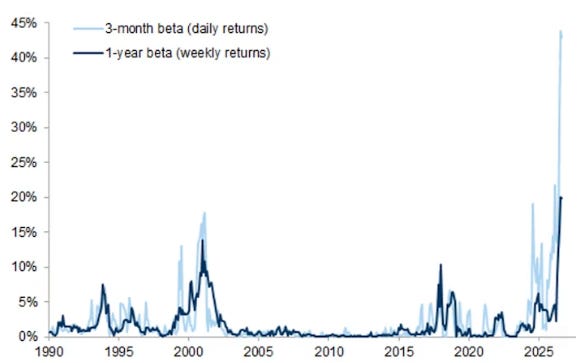
Another measure is beta.
S&P 500 now has the highest number of stocks with a negative beta in history.
This means that individual stocks are doing the opposite of what the index is doing at the highest level ever seen.
What’s going on?
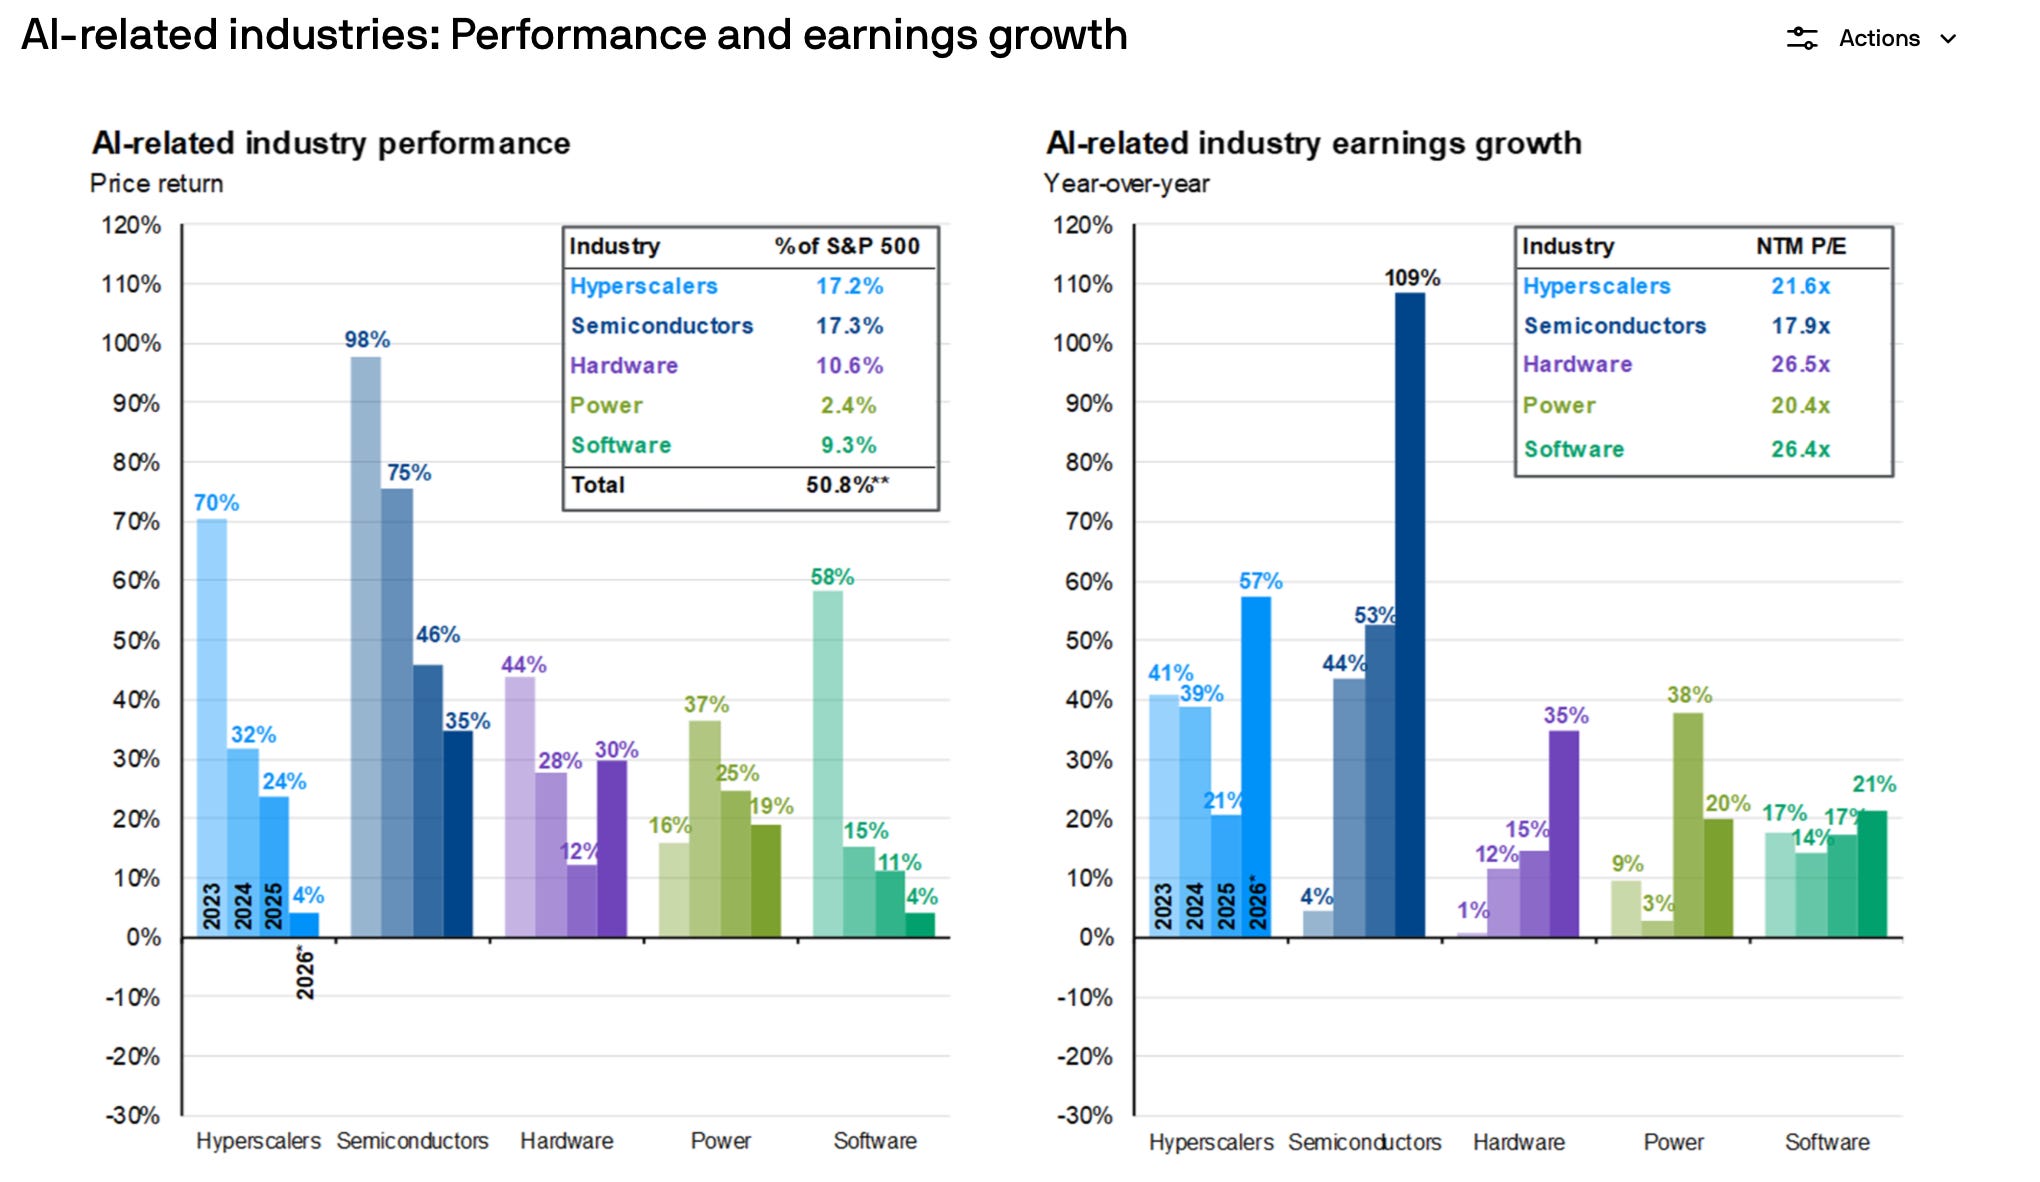
The AI buildout is propping up the index.
Goldman Sachs has said they estimate that hyperscaler capex has driven roughly half of the S&P 500’s EPS growth this year.
If we broaden our view out to everything AI-related, it’s pretty clearly driving more than half.
We’ll talk about all this spending and what it means in the next parts of the series.
See You Then,
-TJ
Used sources
Interactive Brokers: Portfolio data and executing all transactions
Fiscal.ai: Financial data
Disclaimer
As a reader of Compounding Dividends, you agree with our disclaimer. You can read the full disclaimer here.