

Every July, the Tour de France takes over my house.
We get pulled in and watch every stage
It’s the most famous and demanding bike race in the world, and it can teach you a lot about investing.
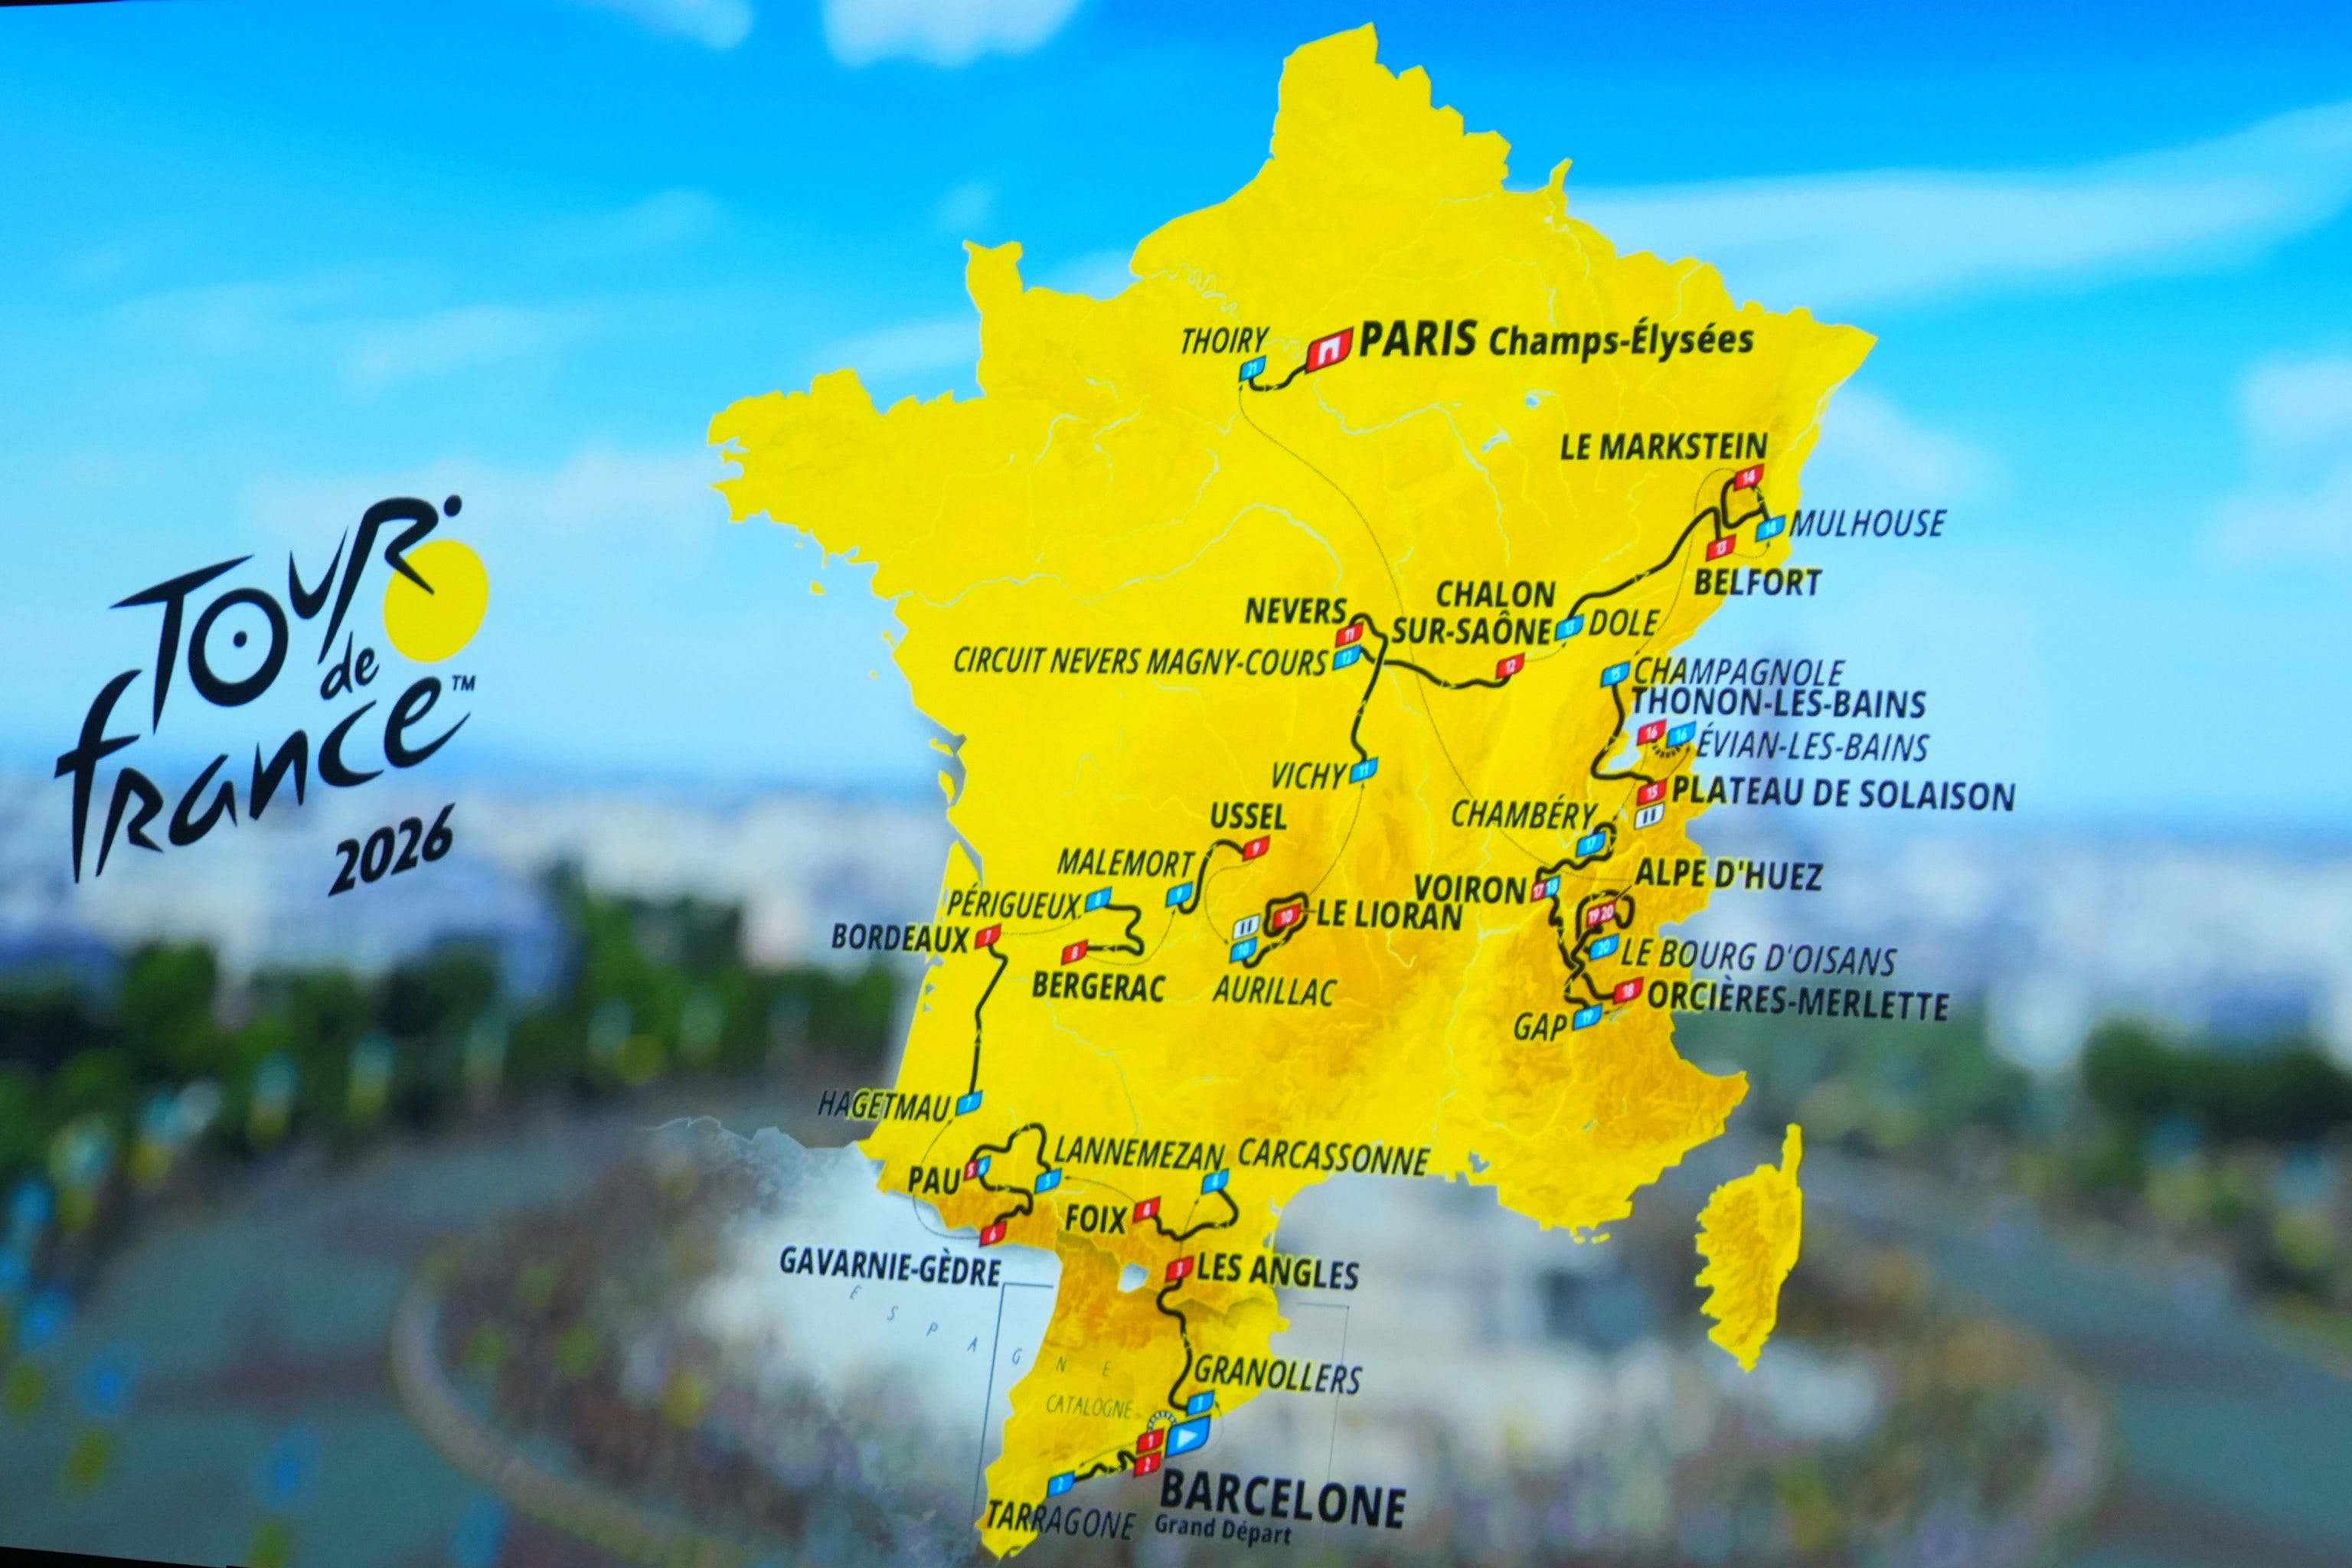
Somewhere around 200 riders race roughly 3,500 km (2,200 mi) across flat plains, rough cobblestones, and up and down the alpine peaks of France.
If you watch the race, you’ll see the peloton, the main pack of riders, cycling tightly together at high speeds.
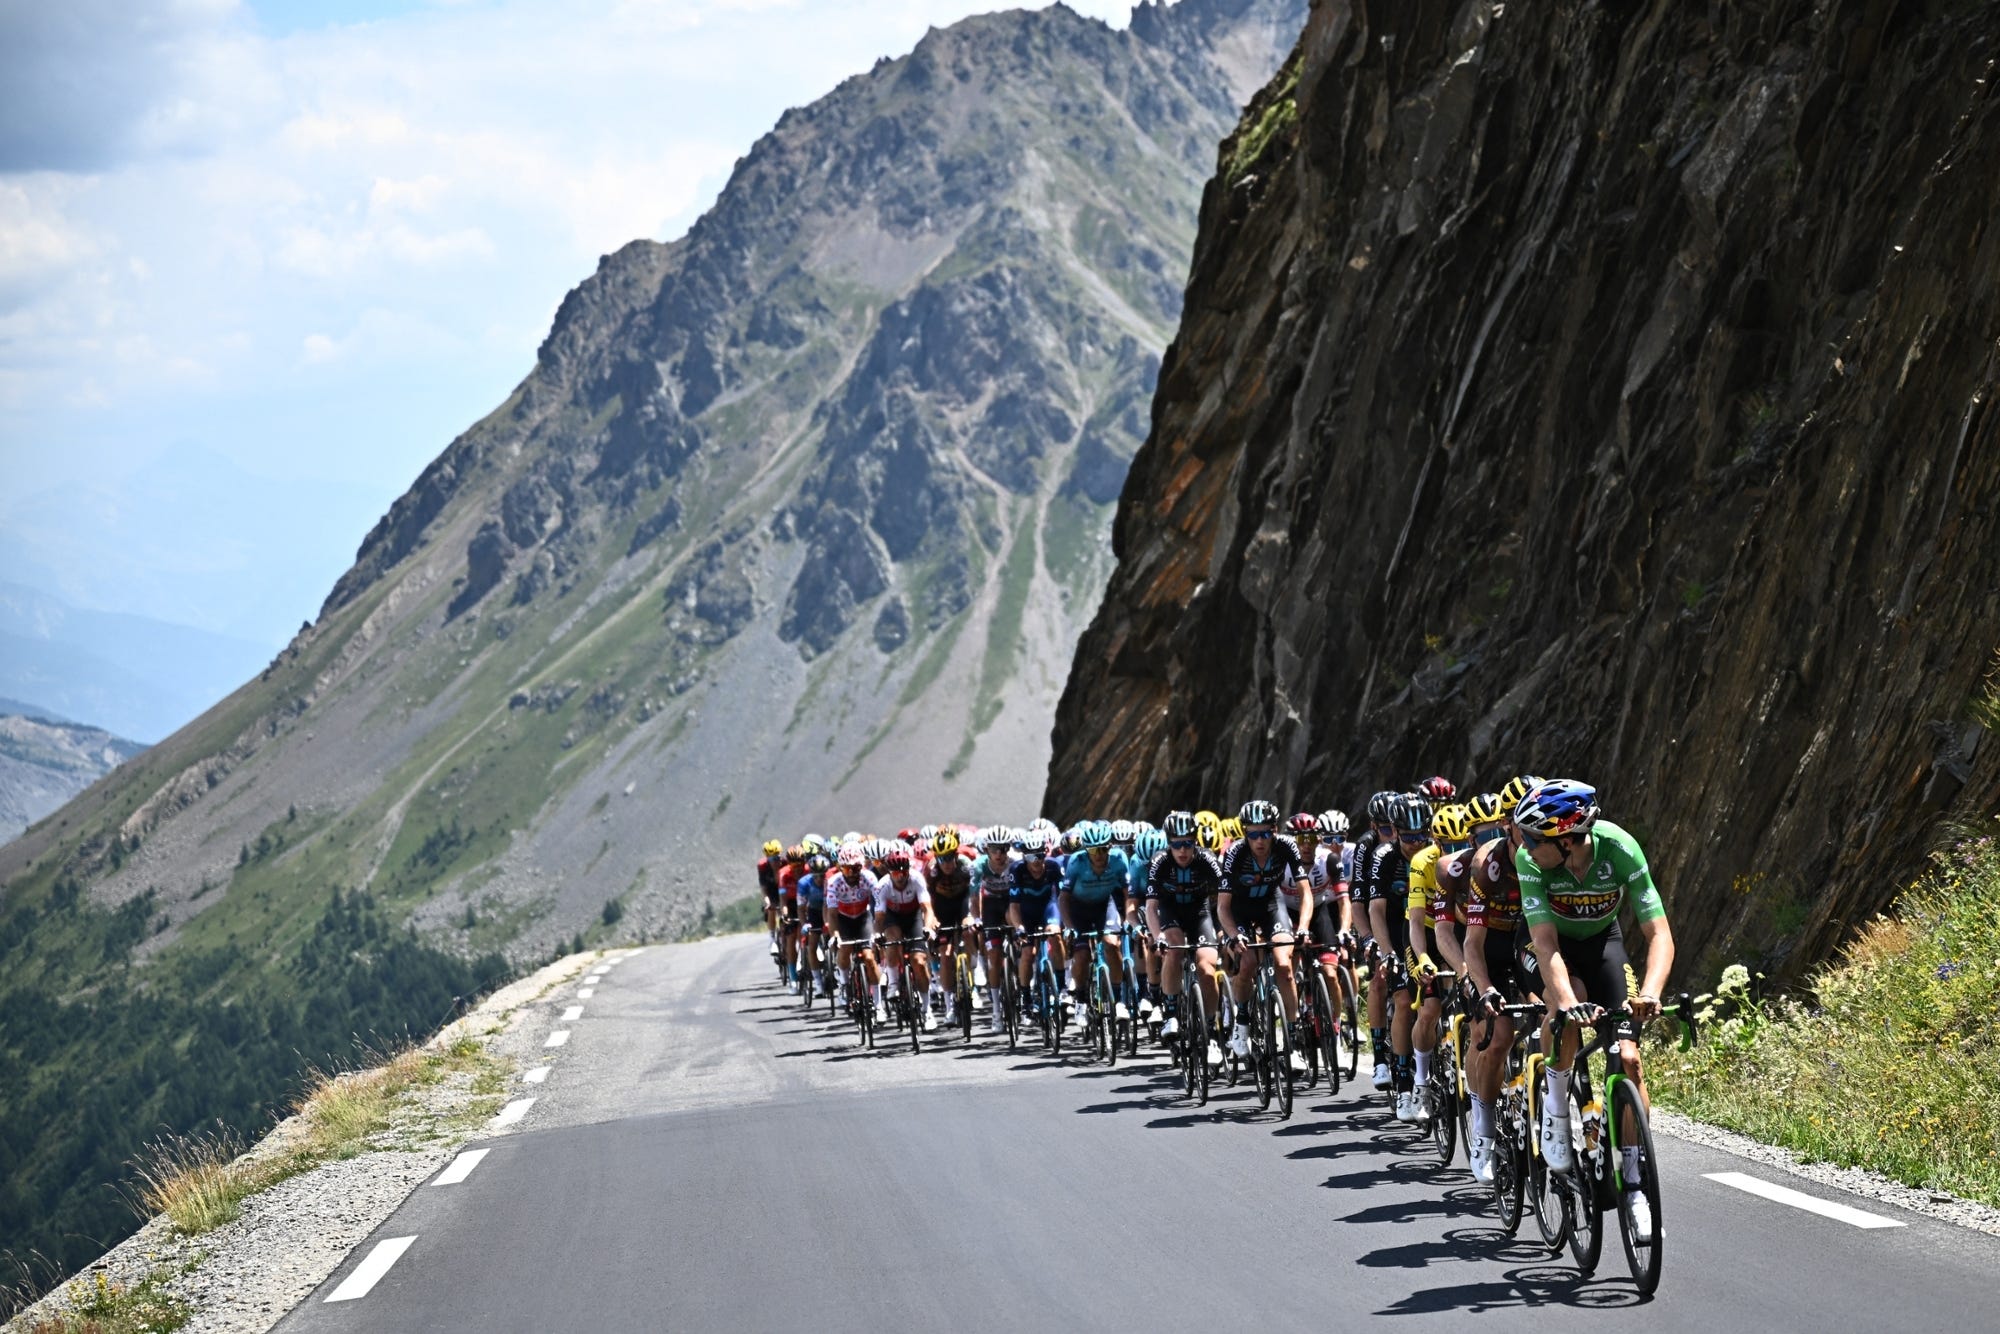
If you’re not familiar with what’s going on, it looks like one big race where everyone is trying to get to the finish line first.
But it’s not.
The Tour de France is actually several completely different competitions happening at the exact same time, on the exact same road.
Here are the different games being played inside that pack:
Stage Wins: The Tour is broken up into 21 “stages” (one race per day). A lot of riders are there just to win a single day’s race
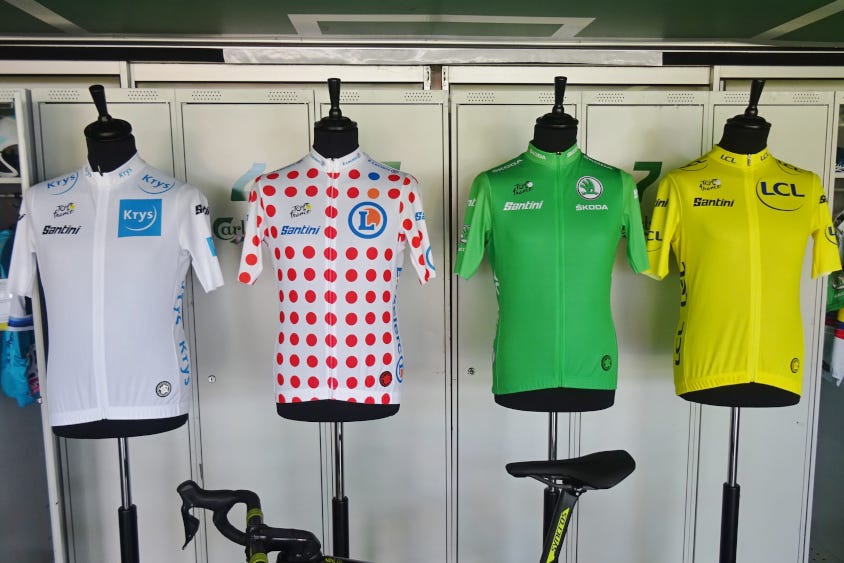
The Green Jersey (Points Classification): This gets awarded to the best sprinter. These riders only care about winning ‘intermediate sprints’ (think mini finish lines in the middle of stages), or being the winner at the end of specific, flatter stages.
The Polka Dot Jersey (King of the Mountains): Awarded to the climbers. These riders get points for being the fastest up the steepest, longest climbs in the race.
The White Jersey (Best Young Rider): Awarded to the fastest rider under the age of 26. These guys are really only racing the other young riders.
The Yellow Jersey (General Classification): This is the ultimate prize. It is awarded to the rider with the lowest cumulative time across all 21 stages. To win this one, you have to be good at everything (and have a strong team to help you).
What’s this have to do with investing?
Read on, and you’ll see where I’m going.
The Stock Market is a Peloton
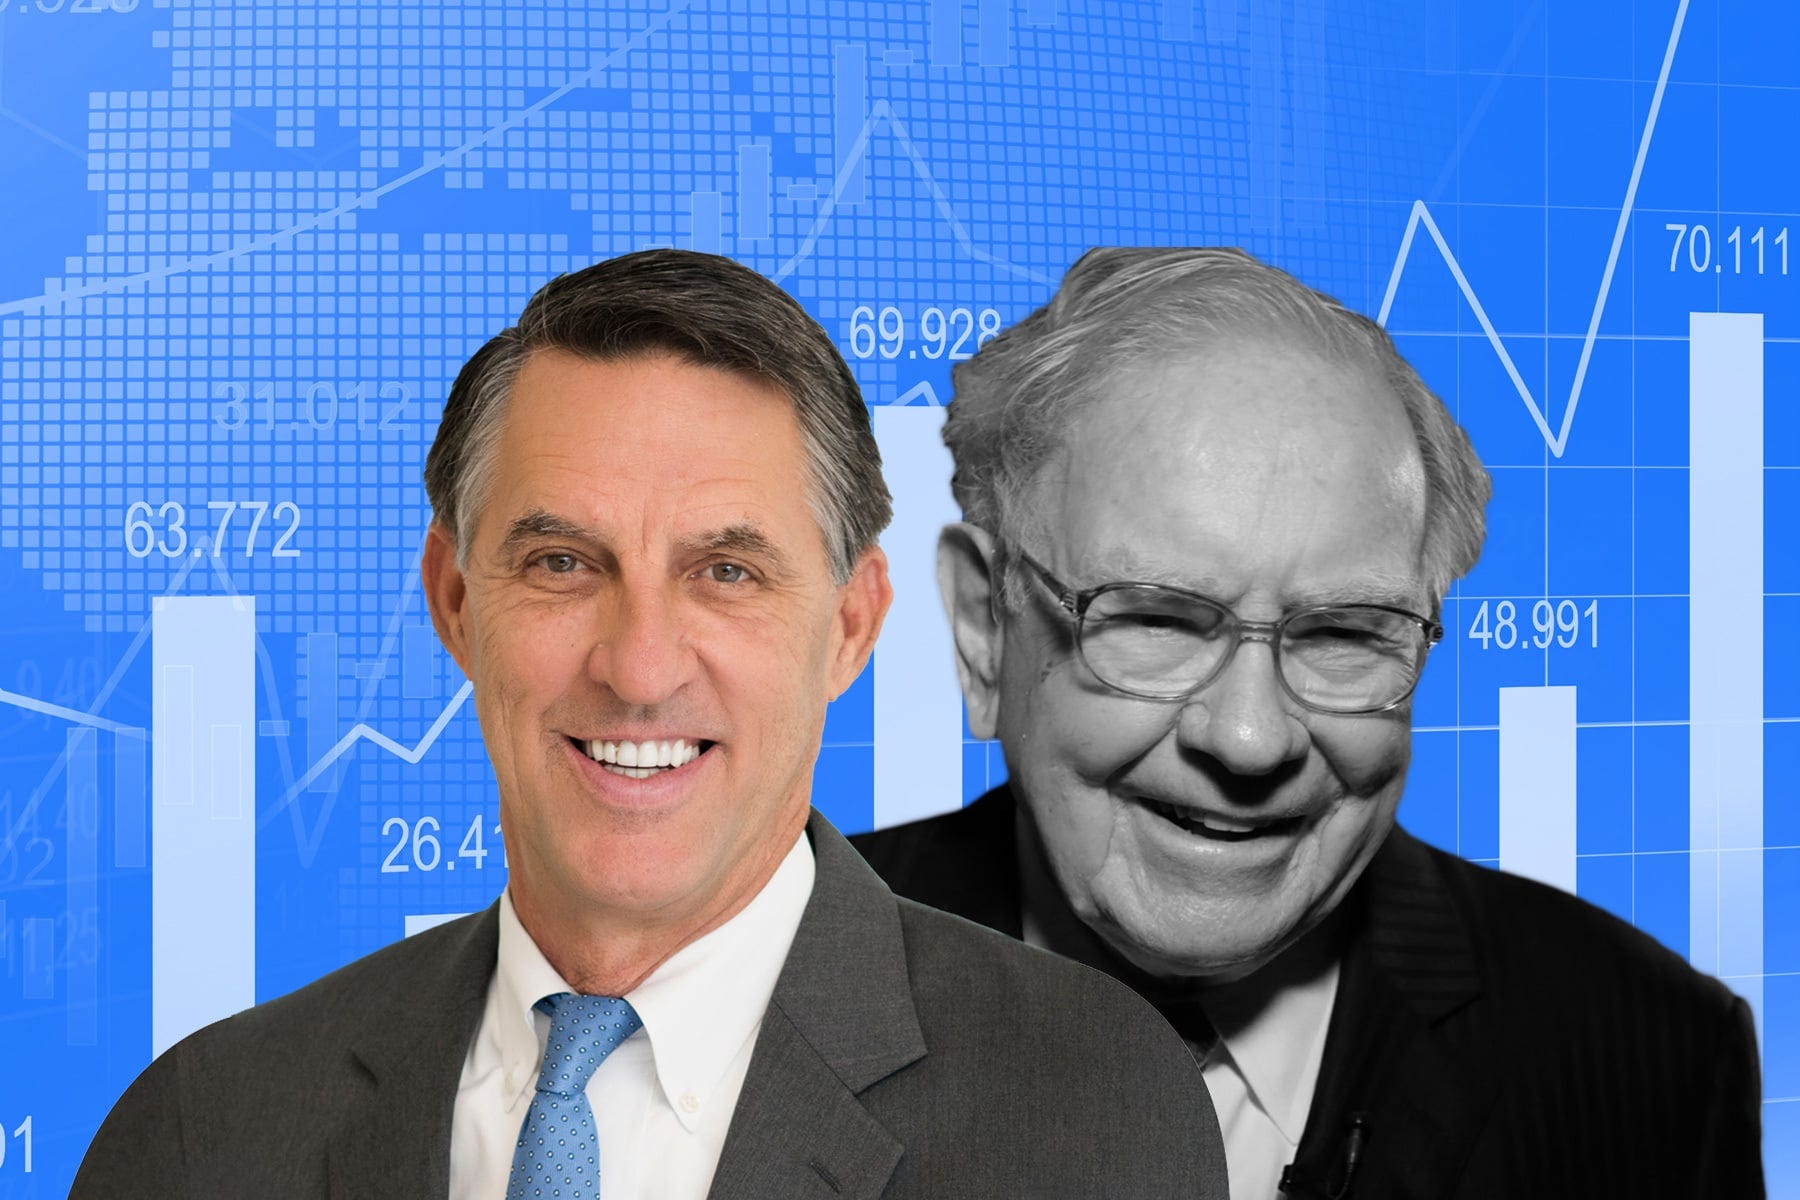
Recently, Robert Hagstrom, author of The Warren Buffett Way, described the stock market as "heterogeneous."
What he means is that it isn’t one thing, with one goal.
It’s a collection of different players, playing different games, with completely different rules.
When a stock price moves a lot, it's easy to assume the market knows something you don't.
But most of the time, the move has nothing to do with the strategy you're following.
Just like the Tour de France, the market peloton has more than one competition going on.
Pod Shops: Large hedge funds that use leverage and strict risk limits. They often have to sell automatically when positions move against them.
0DTE Traders: Speculators trading options that expire the same day. Their activity can create large short-term price swings.
Retail Traders: Often driven by social media, momentum, and FOMO.
High-Frequency Traders: Algorithms that profit from tiny price movements measured in fractions of a second.
Macro Funds: Investors making bets on interest rates, inflation, currencies, and economic trends.
Event Traders: Investors focused on earnings reports, mergers, drug trials, and other major news events.
Fundamental Investors: Long-term owners focused on cash flow, balance sheets, competitive advantages, and business quality.
That’s not even everybody, but I think you get the picture.
If hedge funds are forced to sell, options traders pile in, and momentum algorithms amplify the move, a stock might fall 5% in a day.
That doesn't automatically mean anything has changed about the business.
Novo Nordisk
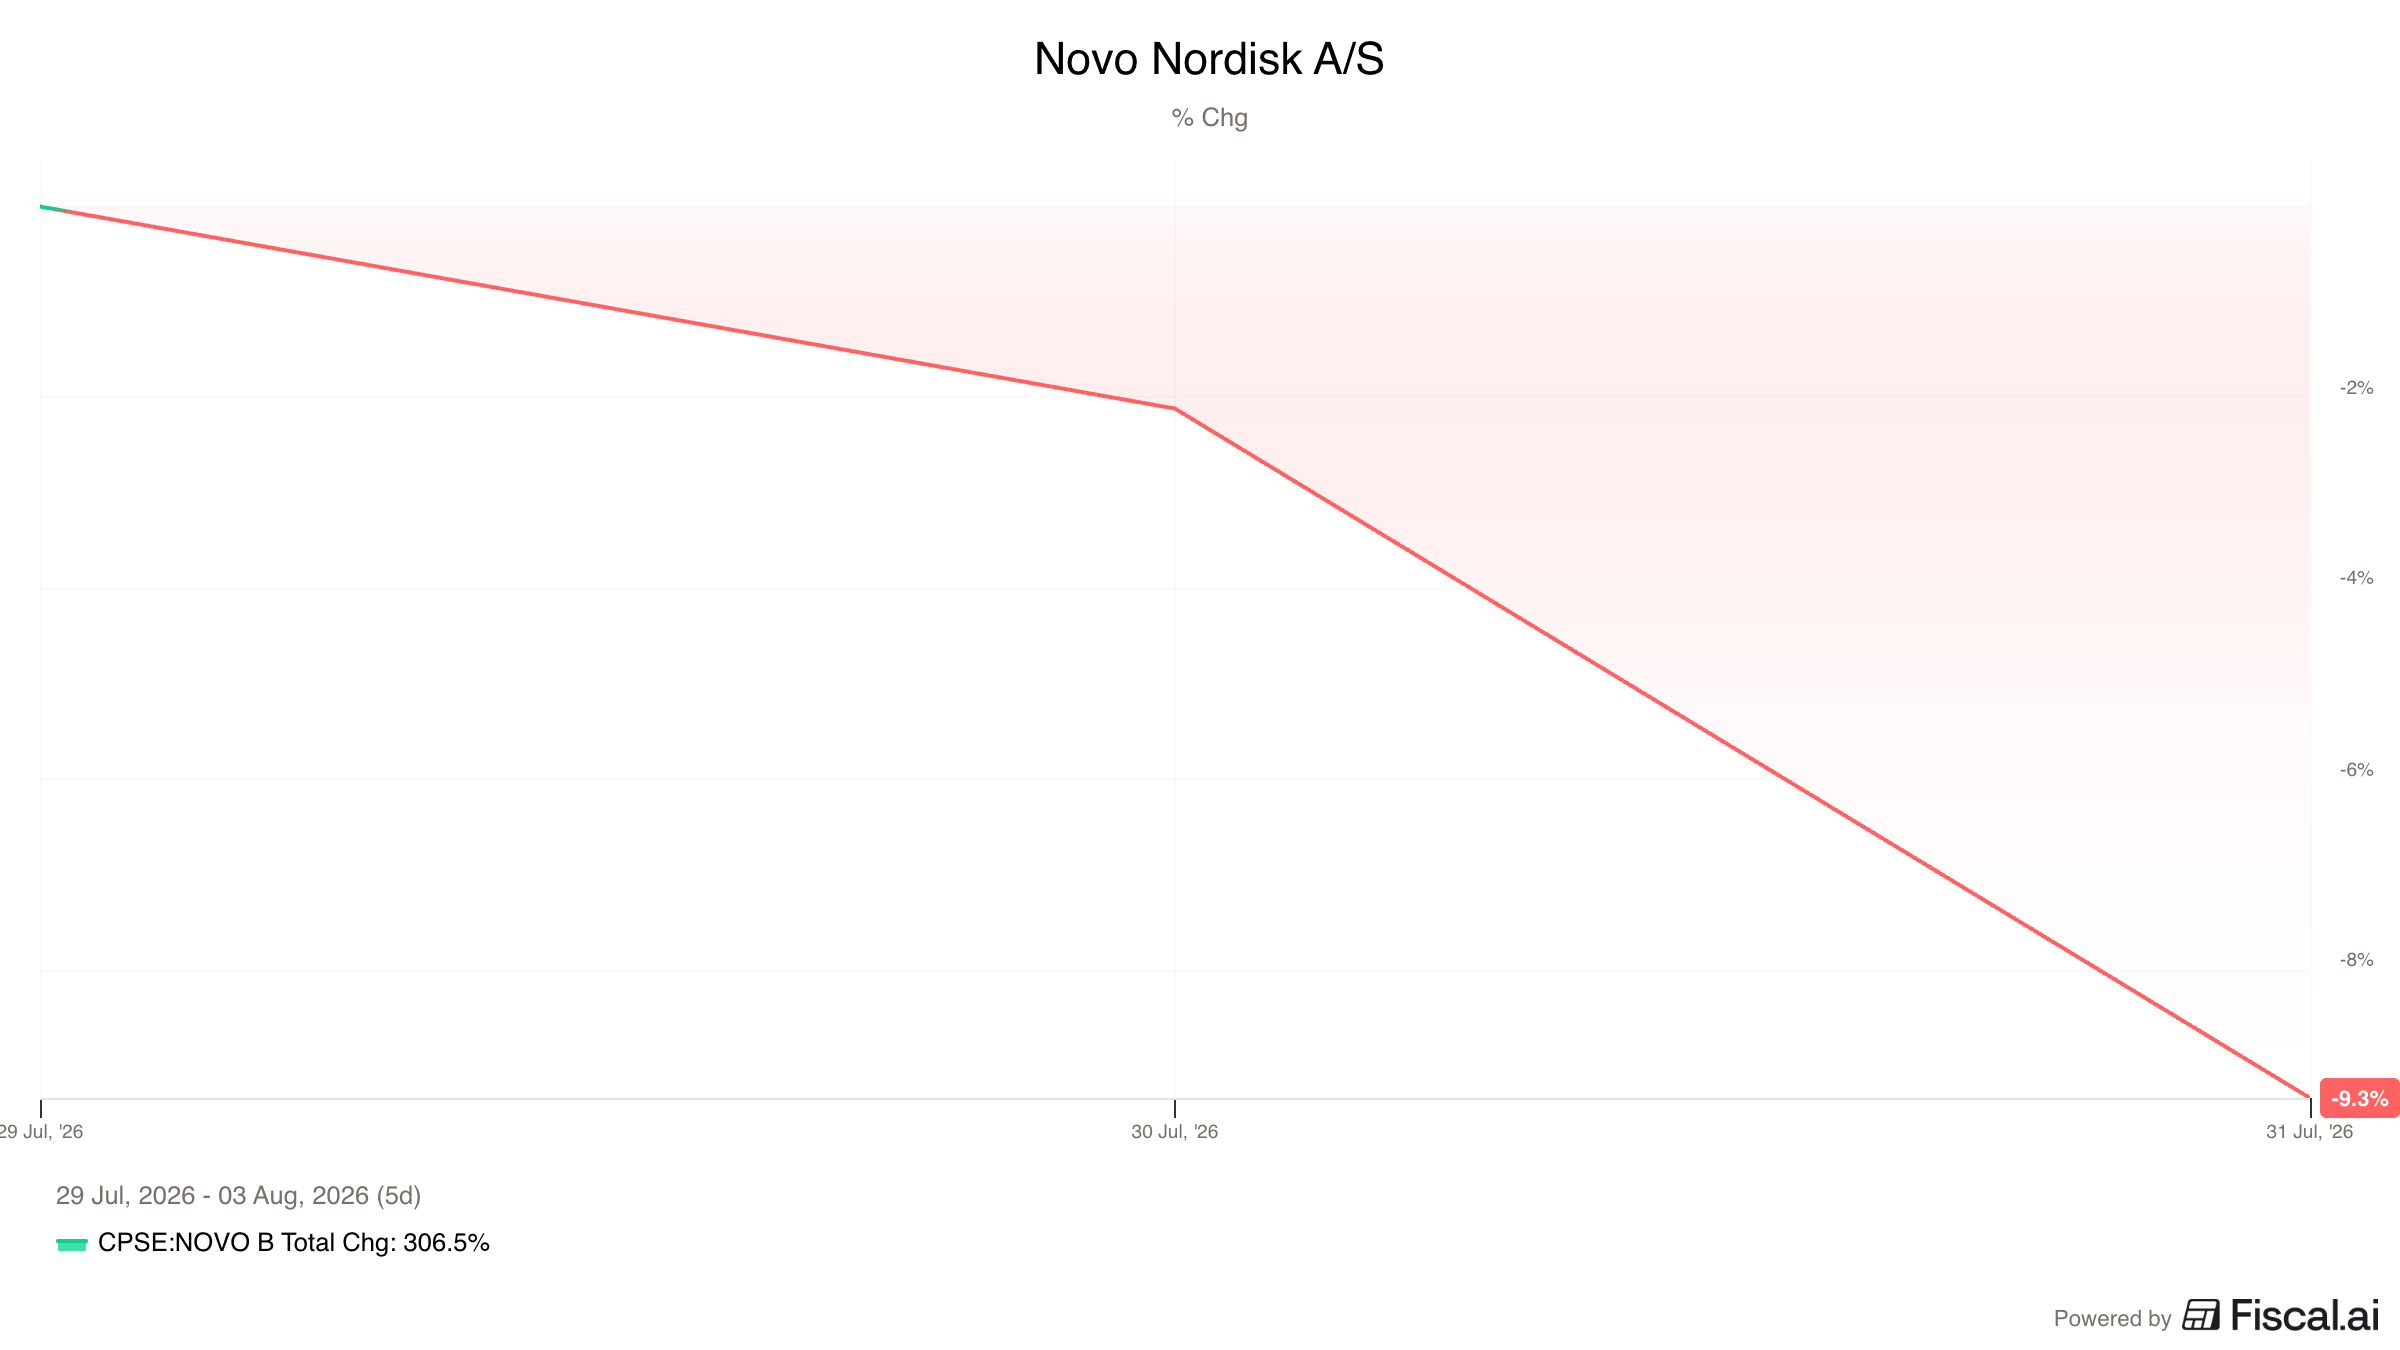
Look at Novo Nordisk just a few days ago on July 31st.
The stock fell around 8% in a single day because an experimental heart drug called ziltivekimab failed a late-stage clinical trial.
How many investors bought Novo Nordisk for ziltivekimab?
My bet is zero.
So how does that kind of selloff happen because of a secondary pipeline headline?
Event-driven traders or saw a “failed trial” headline and dumped shares, or went short.
Algorithms scraped the negative news feeds and did the same.
Multi-manager pod shops hit their daily risk limits and were forced to sell.
There was a cascade of selling based on a bunch of short-term games within the market peloton.
For a long-term investor, however, the key question is simple: Did the investment thesis change?
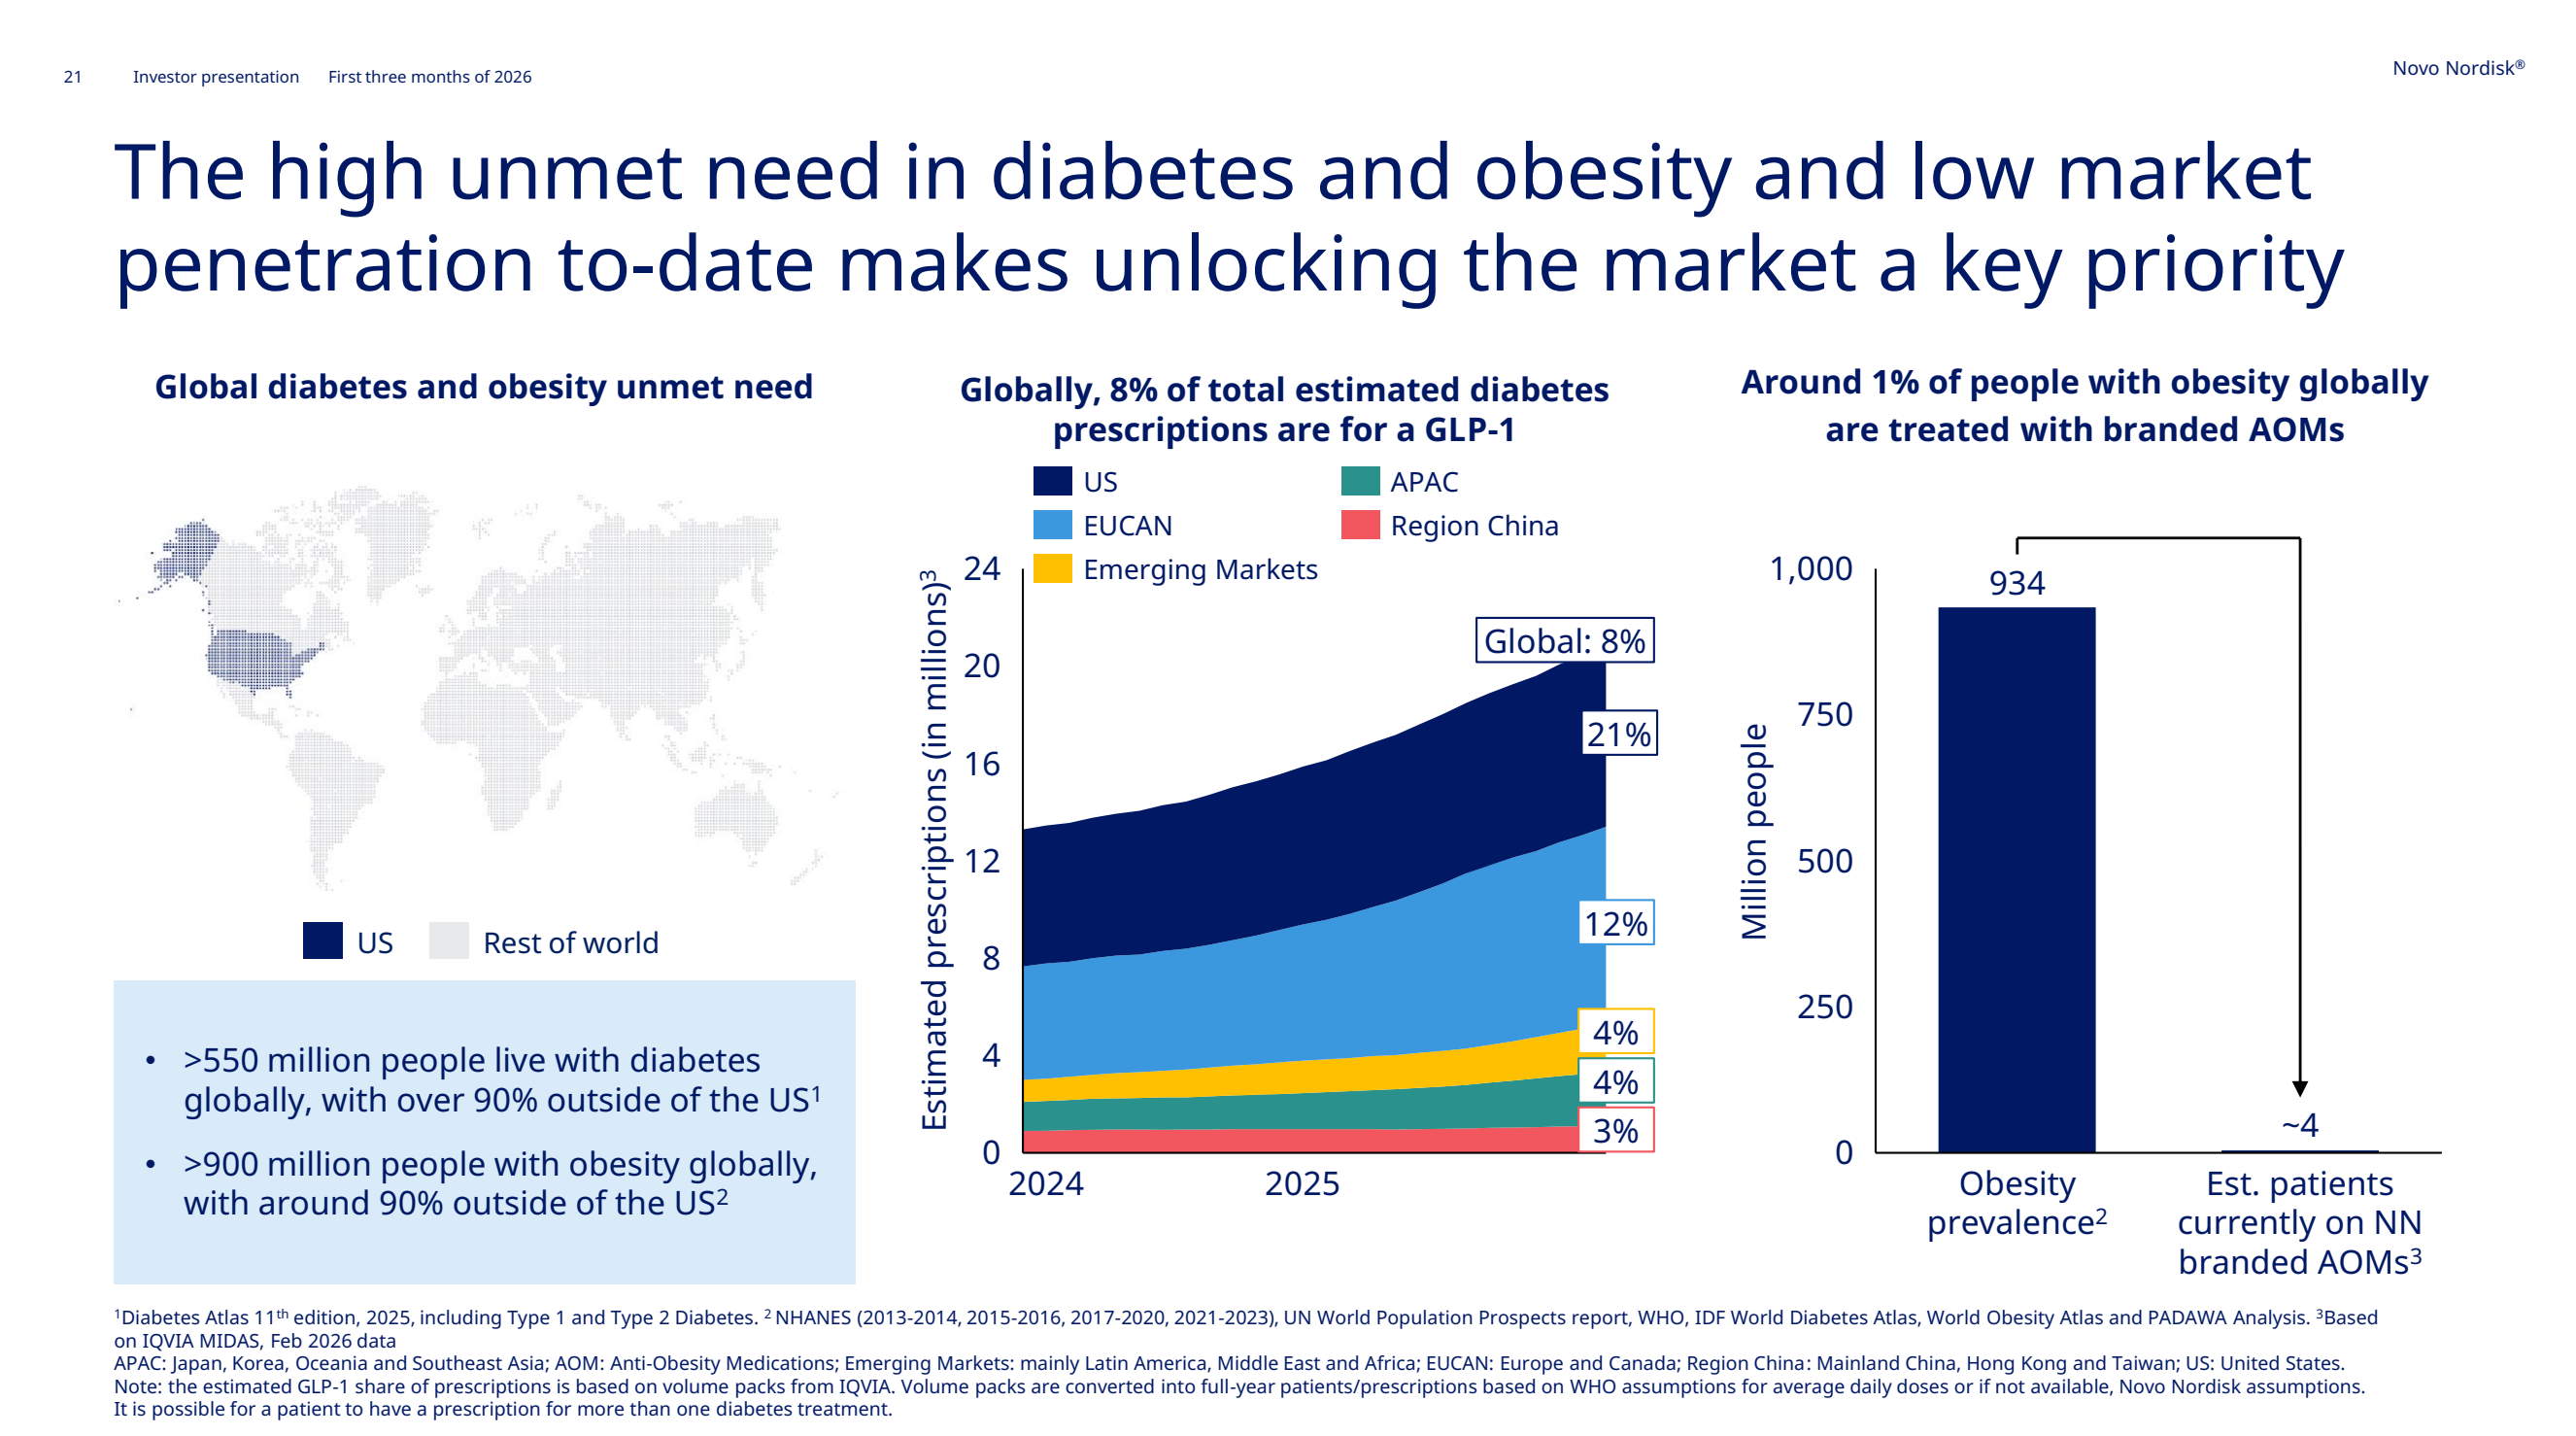
The failed trial didn't change the cash flow generated by Novo's obesity and diabetes drugs.
It also didn't change the long-term demand for those treatments..
Race Your Race
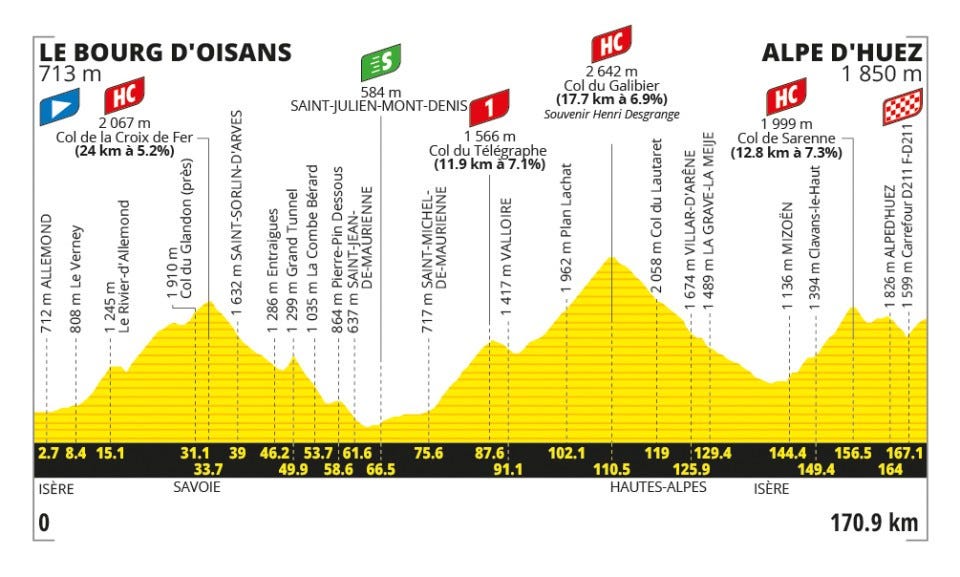
Tadej Pogačar gave us a great example of what it looks like to ignore the games that don’t matter and focus on your own race during Stage 20 of this year’s Tour de France.
It was the final mountain stage, and universally agreed upon to be the most difficult stage of the entire race.
For a while, Pogačar held both the Yellow Jersey for the overall race lead, and the Poka Dot climber’s jersey.
The most important thing was the Yellow Jersey.
Winning it this year would be his 5th Tour win, and would put him in a very exclusive club, with only 4 other riders in it.
At the start of stage 20, Pogačar had the Yellow Jersey virtually locked up.
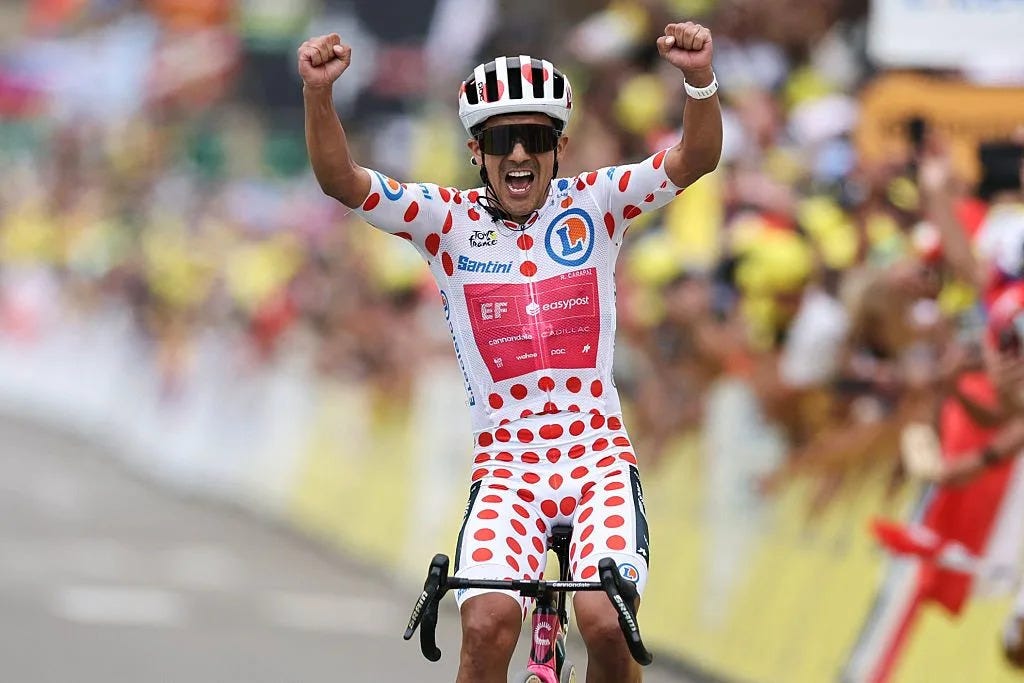
Richard Carapaz had taken the lead for the Polka Dot Jersey earlier in the race, and he attacked in an obvious attempt to win the stage and the Polka Dots.
Pogačar let him go.
Instead, he focused on protecting his overall lead and helping teammate Isaac del Toro secure the White Jersey.
He ignored games that didn't matter because he knew exactly which one he was trying to win.
Investors should do the same.
Know your strategy. Know your time horizon. Ignore the games you’re not playing.
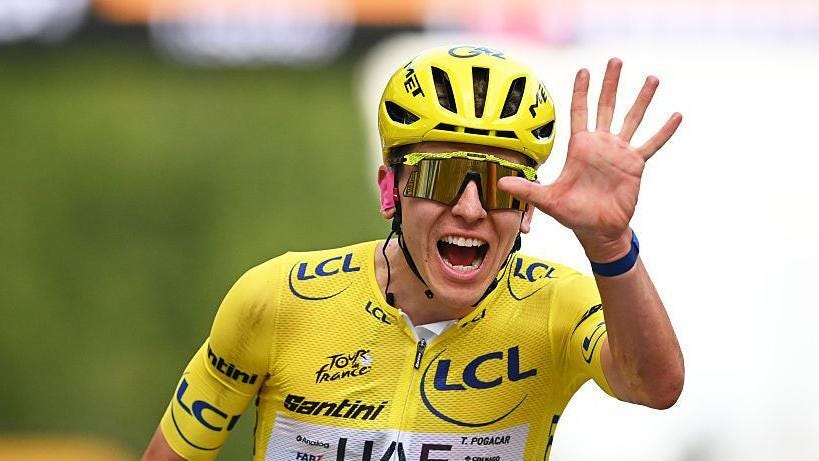
Tadej Pogačar went on to finish Stage 20, then the final Stage in Paris to win his historic fifth Yellow Jersey and secure his place in the cycling history books.
To Win, You Have to Survive
One more lesson from 2026’s Tour de France.
To win, you have to make it to the end.
The Tour de France is notoriously unforgiving.
This year’s tour took out two strong riders.
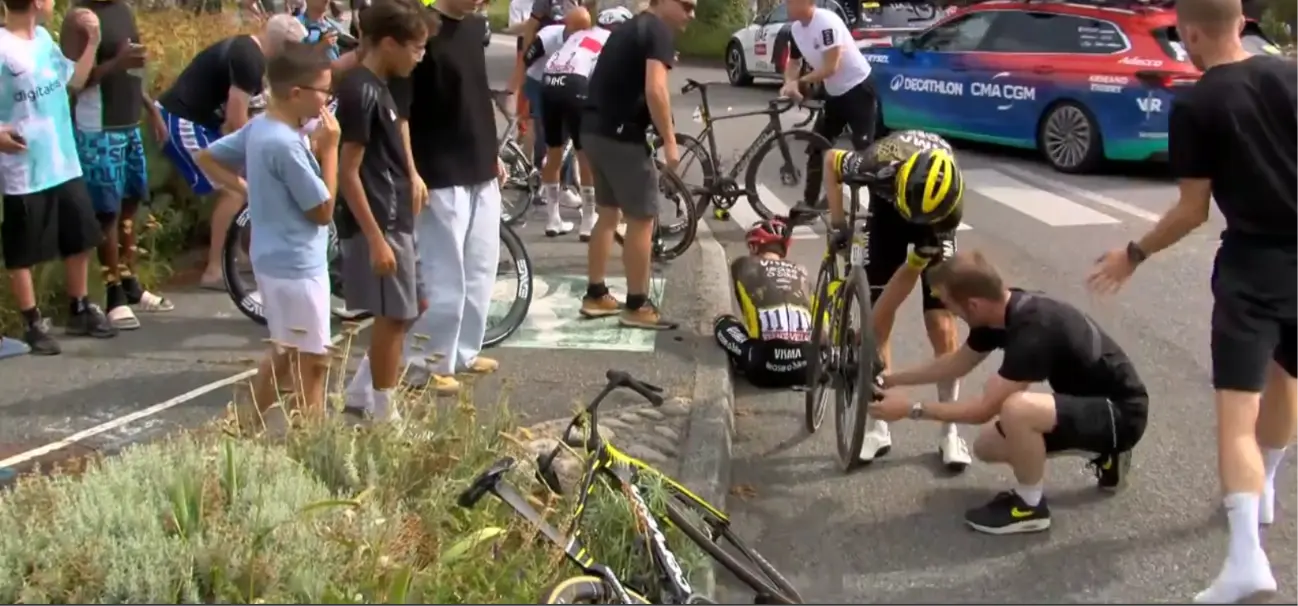
Jonas Vingegaard, a two-time champion, crashed on a pretty routine roundabout during Stage 15, breaking his collarbone and instantly ending his race.
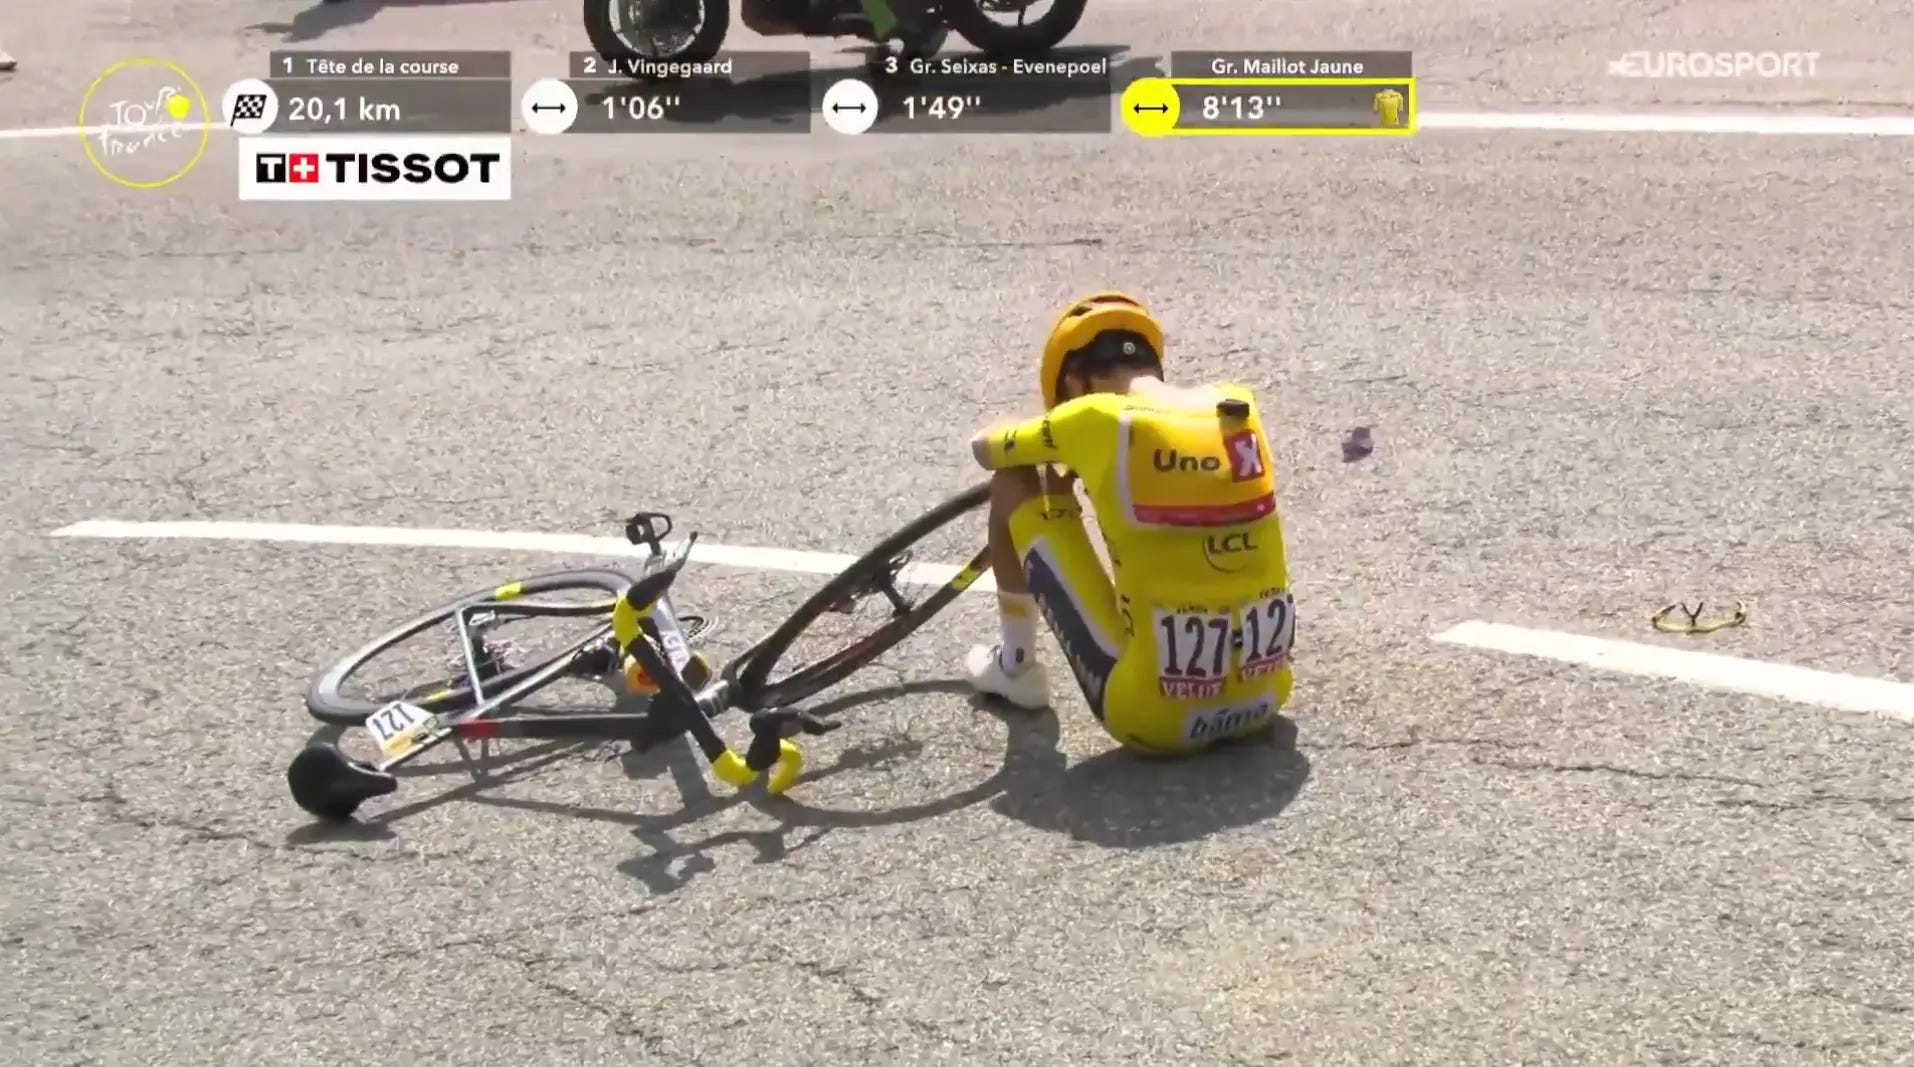
Norwegian rider Torstein Træen was actually wearing the Yellow Jersey when he crashed on the descent of the Col du Tourmalet during Stage 6, ending his race.
In the stock market, crashes are inevitable.
They usually take out investors using excessive leverage or chasing speculative stocks.
Long-term investors who own strong, cash-generating businesses are far more likely to survive the downturns.
And survival is the first requirement for compounding.
That’s It For Today!
Here are the most important things you learned:
The stock market is full of different players, playing different games.
A stock going up or down doesn’t always mean anything important has changed about the business.
Know why you own each business, and ignore short-term market noise.
Focus on your own game, and don't get pulled into games other people are playing.
To win the long game, you have to make it to the end, risk management makes sure you do.
One Dividend At A Time,
-TJ
P.S. Want to screen for Yellow Jersey Contenders?
I just ran a quick screen based on cash flow, capital allocation, dividend safety, and balance sheet safety.
Here's the criteria I used:
1. Cash Flow
Free Cash Flow Conversion (≥90% FCF / Net Income): Accounting profits can be manipulated; cash flow cannot. This ensures at least 90 cents of every dollar in net income becomes actual, usable cash.
5-Year Free Cash Flow Growth (≥5% Unlevered FCF CAGR): The cash flow engine must be expanding over a full multi-year market cycle, not stagnating.
Free Cash Flow Yield (≥3.5%): Protects against overpaying for quality by ensuring a strong baseline cash yield relative to share price.
2. Capital Allocation & Dividend Safety
Payout Ratio (≤60%): Retains at least 40% of earnings to reinvest in the business, pay down debt, or cushion against sudden economic headwinds.
Share Count Reduction (≤0% 5-Year Share Growth CAGR): Zero share dilution. Management must be holding share count flat or actively shrinking it through share buybacks.
Return on Invested Capital (≥8% 5-Year Average ROIC): Demonstrates sustained capital efficiency and a durable competitive moat.
3. Balance Sheet
Interest Coverage (≥5.0x EBIT / Interest Expense): Ensures the company generates more than enough operating profit to cover interest obligations, even if debt costs rise.
Leverage Ratio (≤2.5x Net Debt / EBITDA): Keeps debt low enough to prevent financial distress during sudden market drawdowns or recessions.
79 companies in the U.S., Australia, Europe, and the U.K. made it through.
If you want to see them, click the button below and enter your email for instant access.
Used sources
Interactive Brokers: Portfolio data and executing all transactions
Fiscal.ai: Financial data
Disclaimer
As a reader of Compounding Dividends, you agree with our disclaimer. You can read the full disclaimer here.
DJ, I loved the analogy between investing in the stock market and the Tour de France race.
When I talk about investing with my children and friends, I like to use an analogy of my own. I believe it was my Wing Chun teacher who told me once: "It is easy to hit, while it's hard not to get hit. Defense is more important than attacking your opponent". And so, I try to "defend" my portfolio while still earning excellent returns. Avoiding getting knocked out should be number one priority for every investor or even speculator.