

We’ve looked at how the AI boom is keeping the market afloat, how it’s being financed, and some of the limitations it’s now hitting.
The obvious question now is why hasn’t the bubble popped yet?
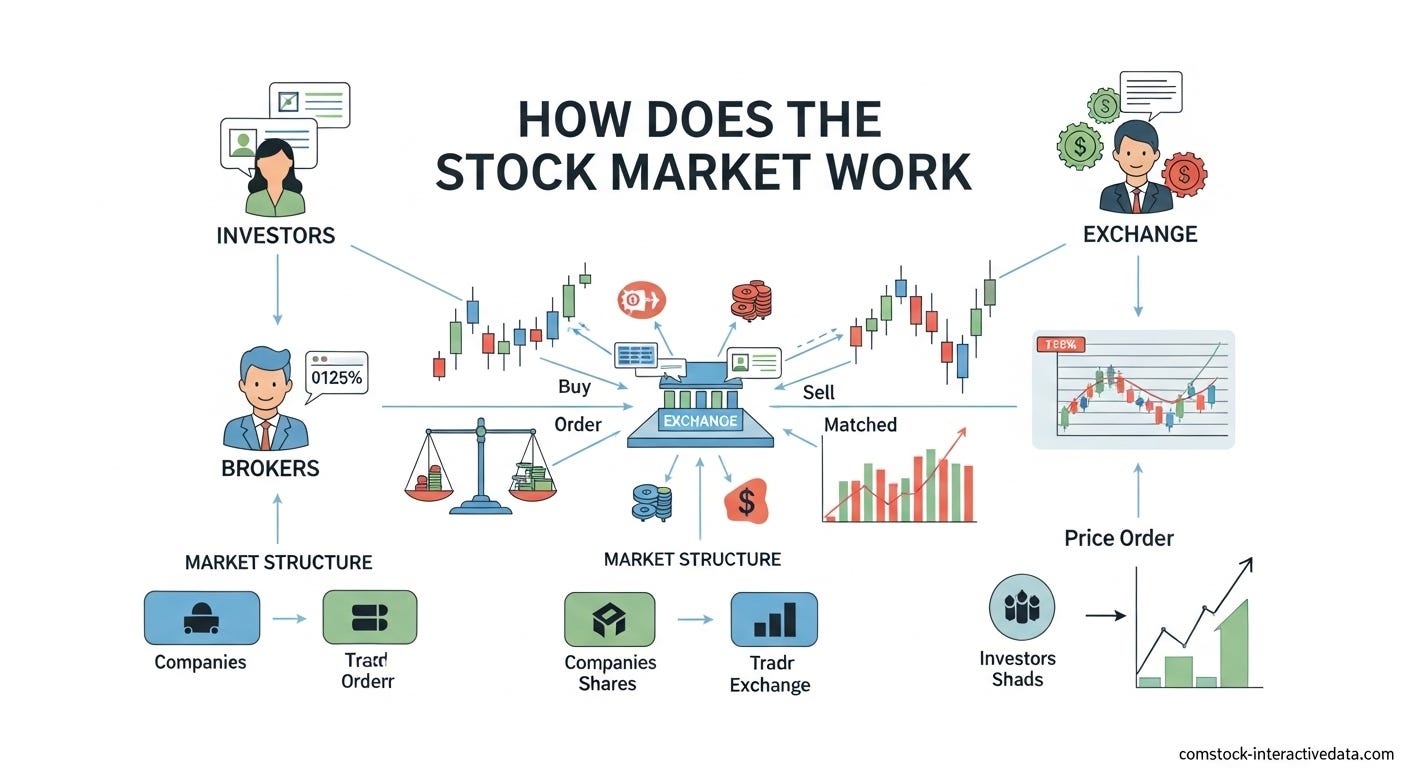
To answer that we have to understand some shifts in market structure.
We talked about some of this in my series on why Terry Smith is changing his strategy.
A lot of what’s keeping the market up is the constant influx of passive flows.
To understand why they keep coming, we need to look at how Americans save for retirement.
The De Facto National Pension
The most common retirement plan used to be a defined benefit pension.
In that system, your employer promised that if you worked for them for a set amount of time, that they’d send you a set monthly check for the rest of your life after you retire.
The company set aside money and hired a professional firm to invest it for them to fund the checks.
This still exists in some areas, like a lot of government jobs, and it’s still common in education.
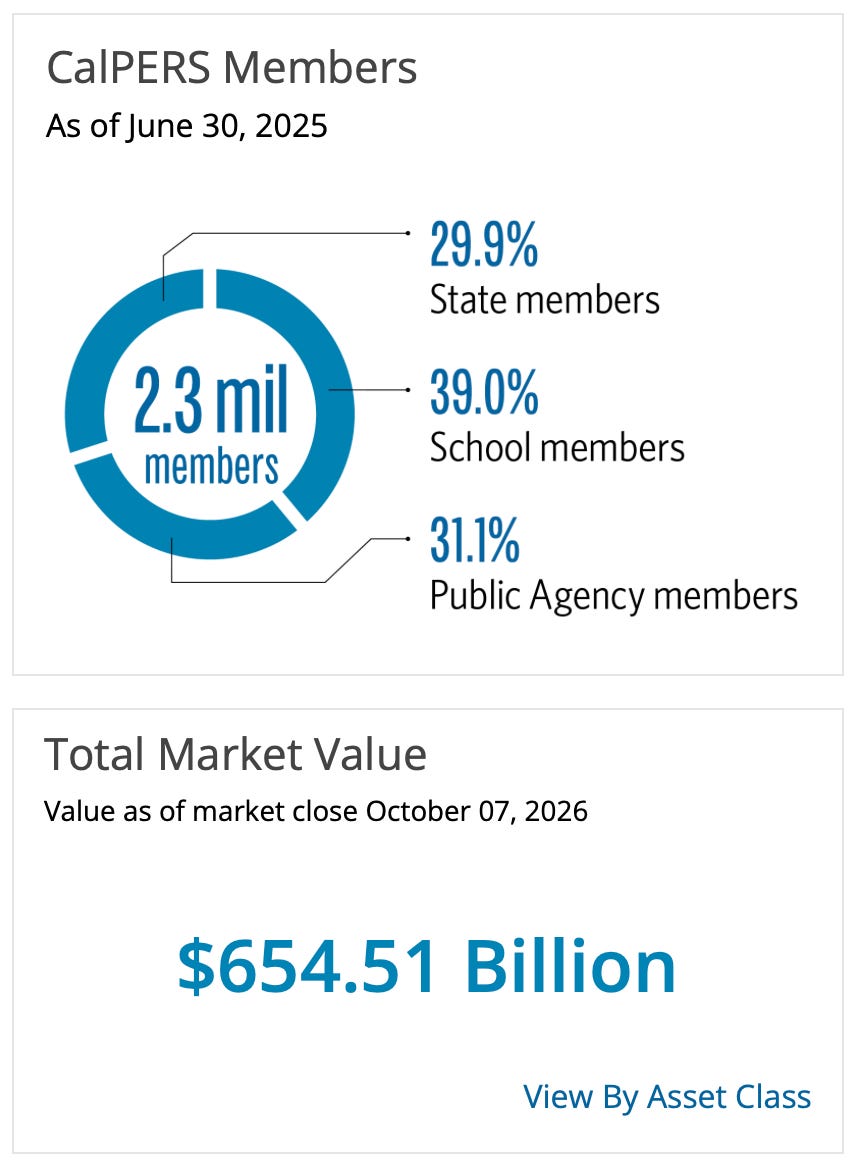
For example, the California Public Employees Retirement Plan, or CalPERS is the pension for firefighters, government employees, teachers, and state administrators.
It’s got 2.3 million members and manages more than $651 billion.
But a an obscureprovision buried in the Revenue Act of 1978 intended to limit tax-deferred cash bonuses for corporate executives flipped the pension system on its head.
In 1980, a benefits consultant named Ted Benna figured out a loophole.

He realized the code could be creatively used to let all employees defer parts of their regular salary into a tax-advantaged account, complete with an employer match.
The IRS officially approved his interpretation in 1981.
That section of code was section 401(k).
And that tax loophole is now the foundation of the American retirement system.
Instead of the company investing money for you and handing you a check, they deposit the money in your 401(k) account.
The responsibility for investing it, and the risk that comes along with it is now yours.
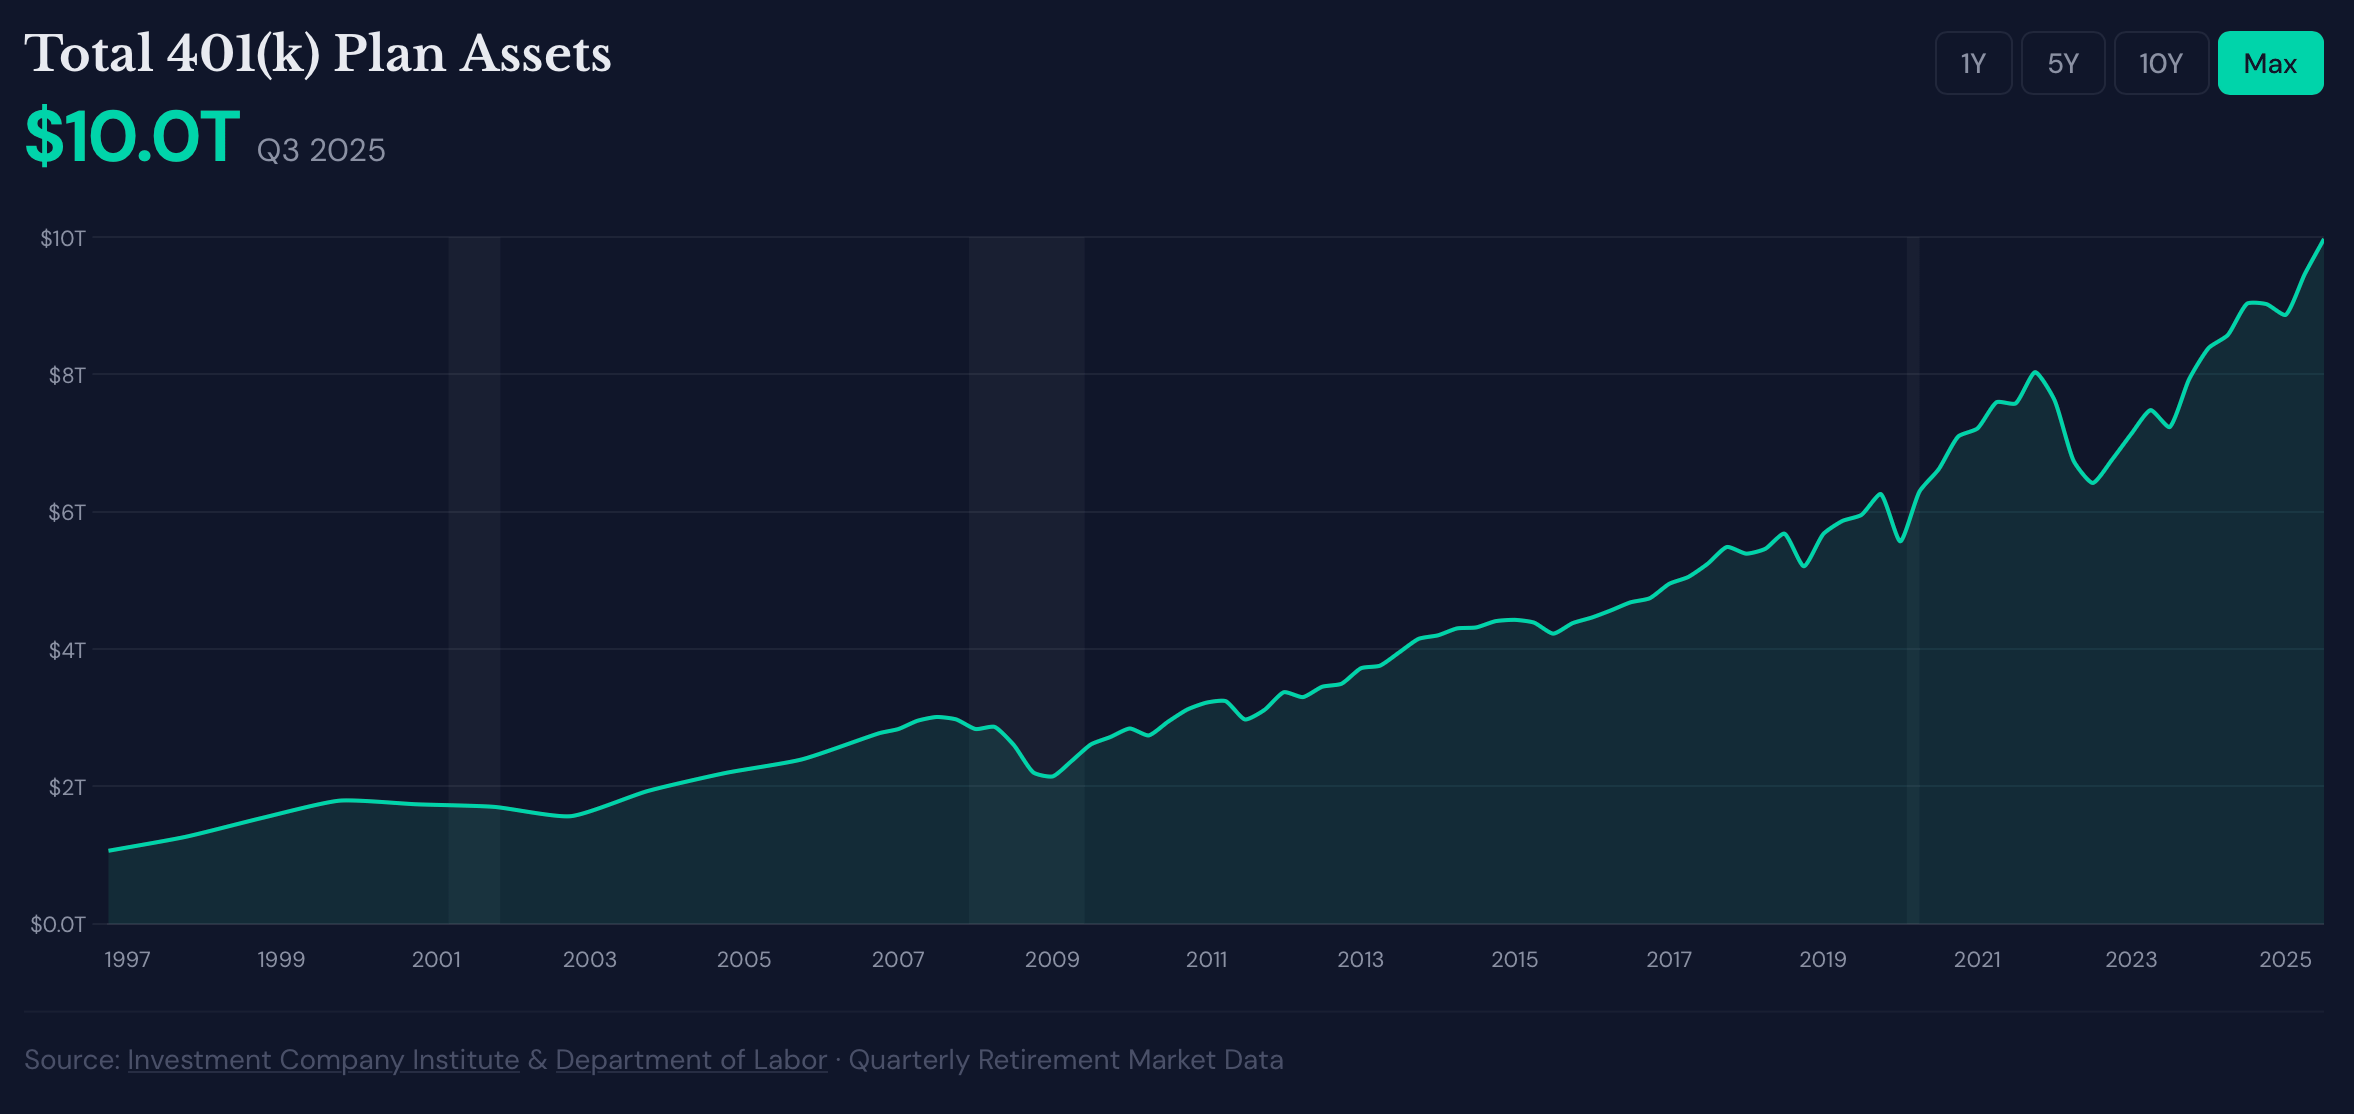
401(k) assets are now over $10 Trillion.
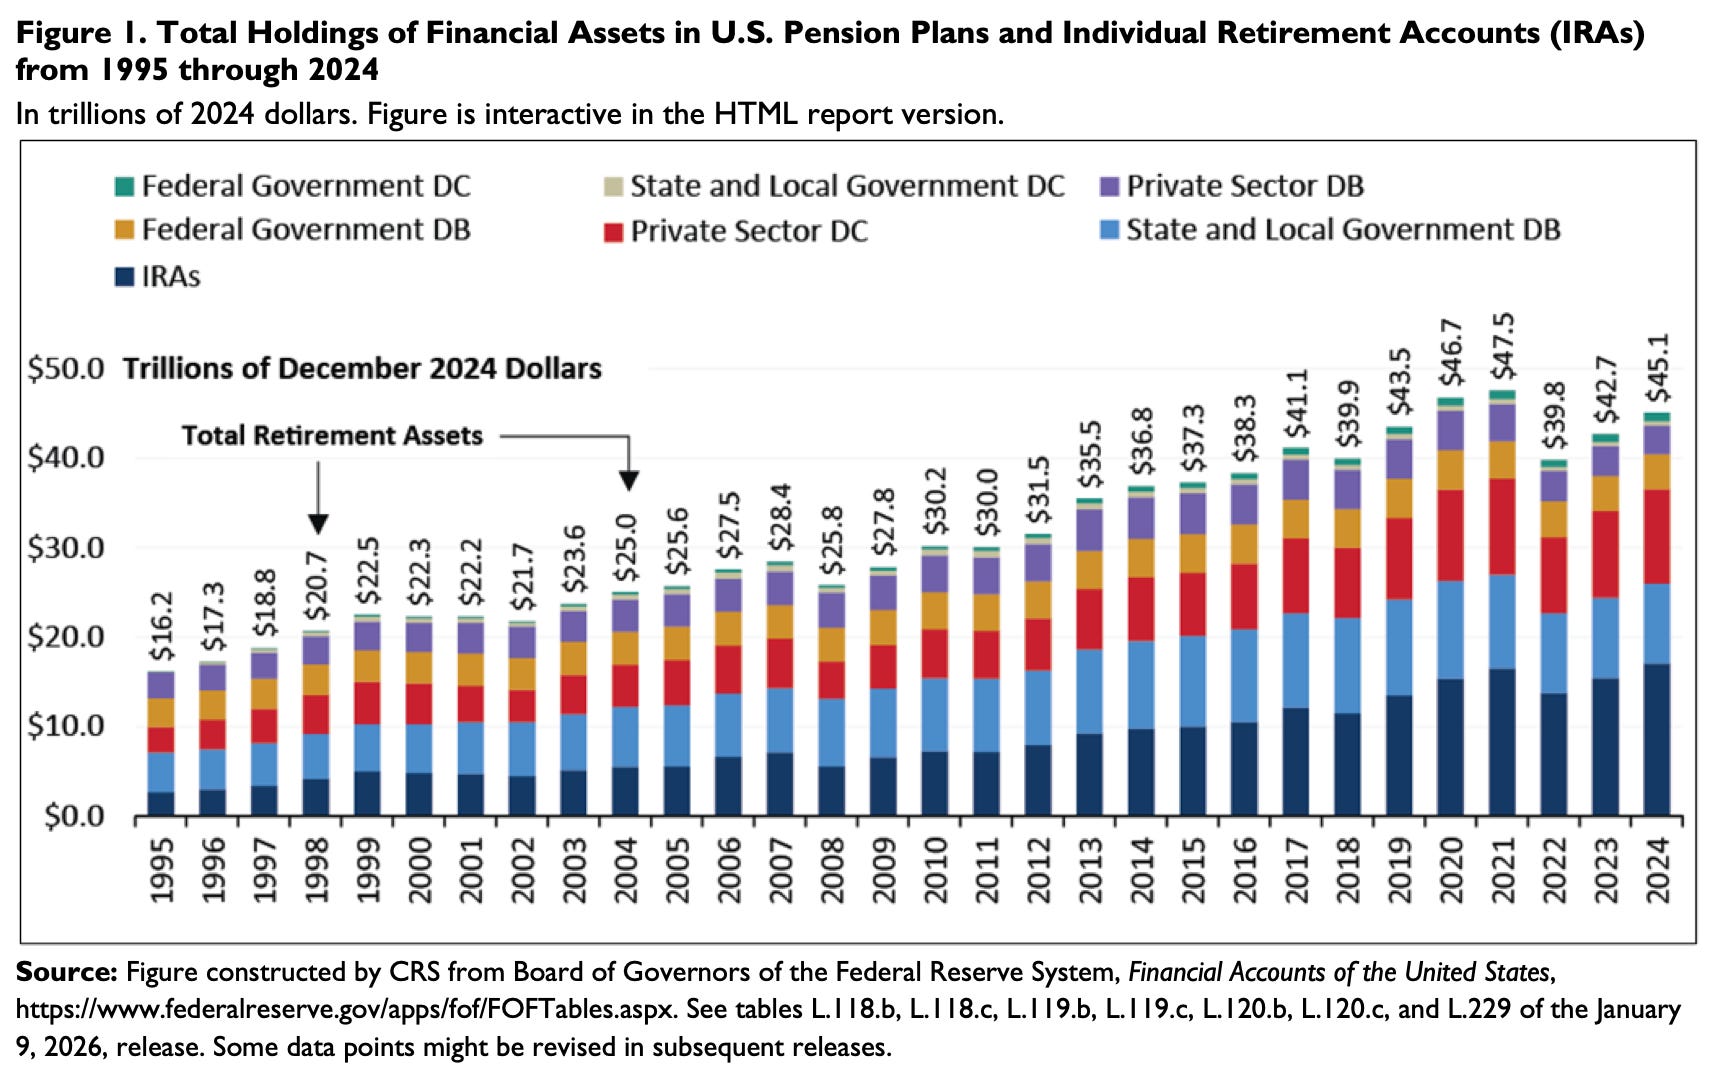
Look at the growth of the 401(k), labeled ‘Private Sector DC’ (for defined contribution), and IRAs (Individual Retirement Accounts) in the chart below.
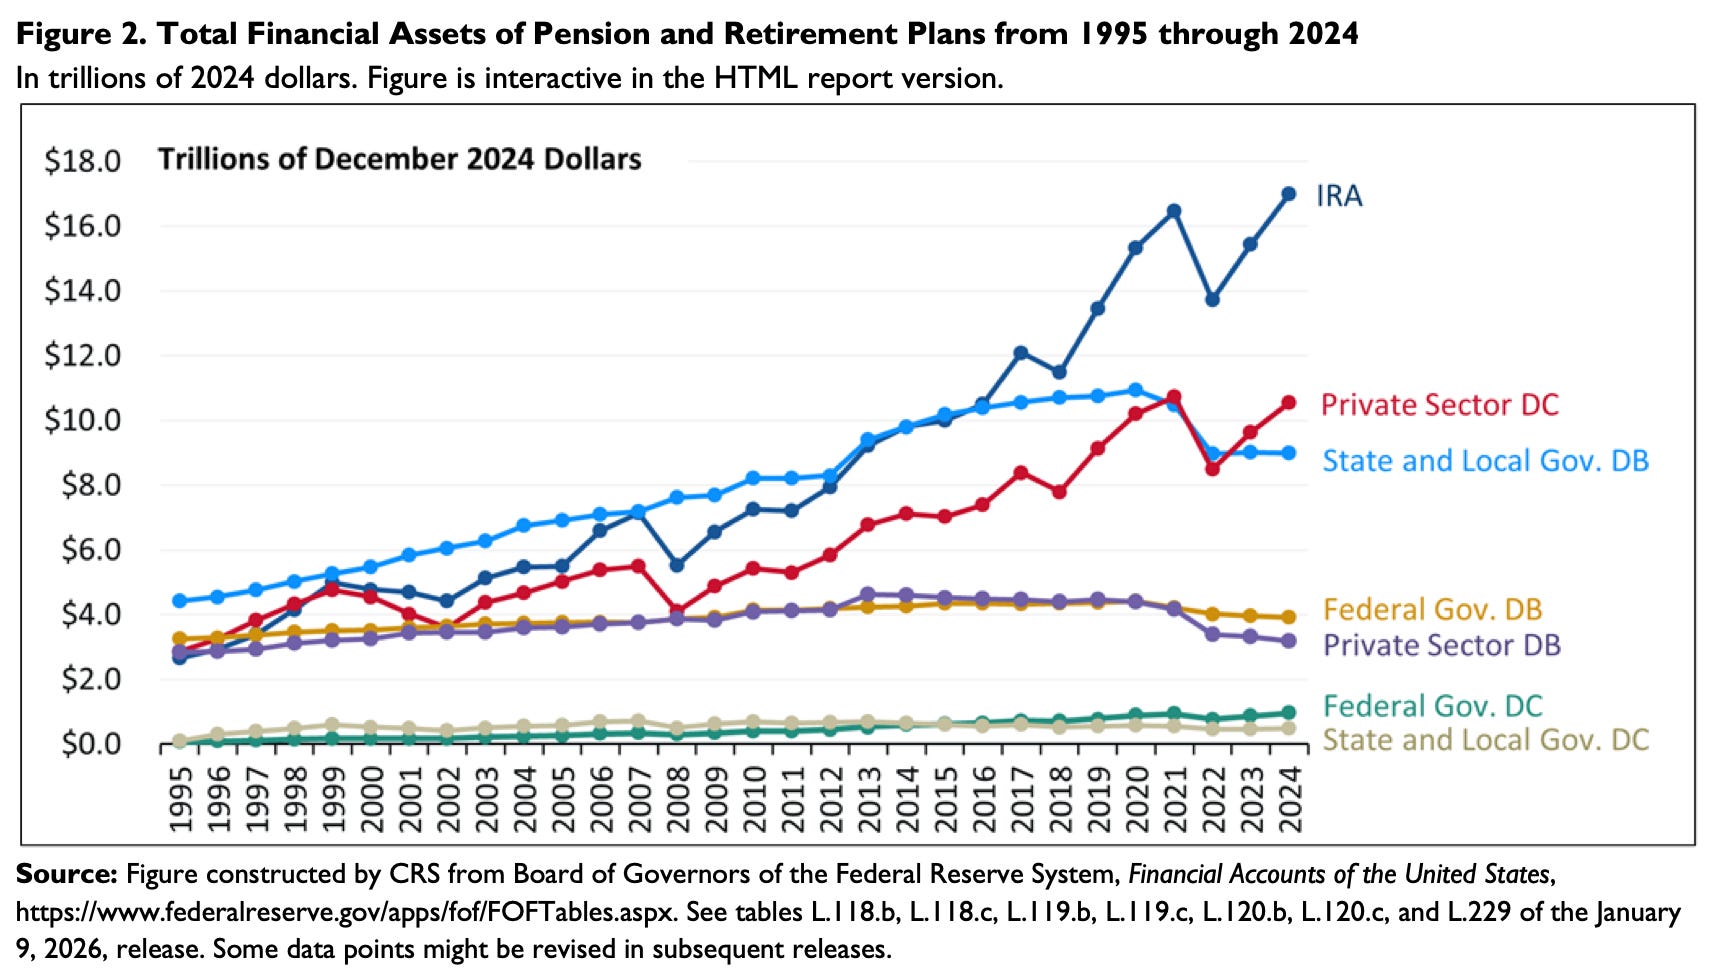
This is the result of hundreds of millions of dollars that are deducted from American paychecks every two weeks and being automatically invested.
All told, Americans have more than $45 trillion in retirement assets.
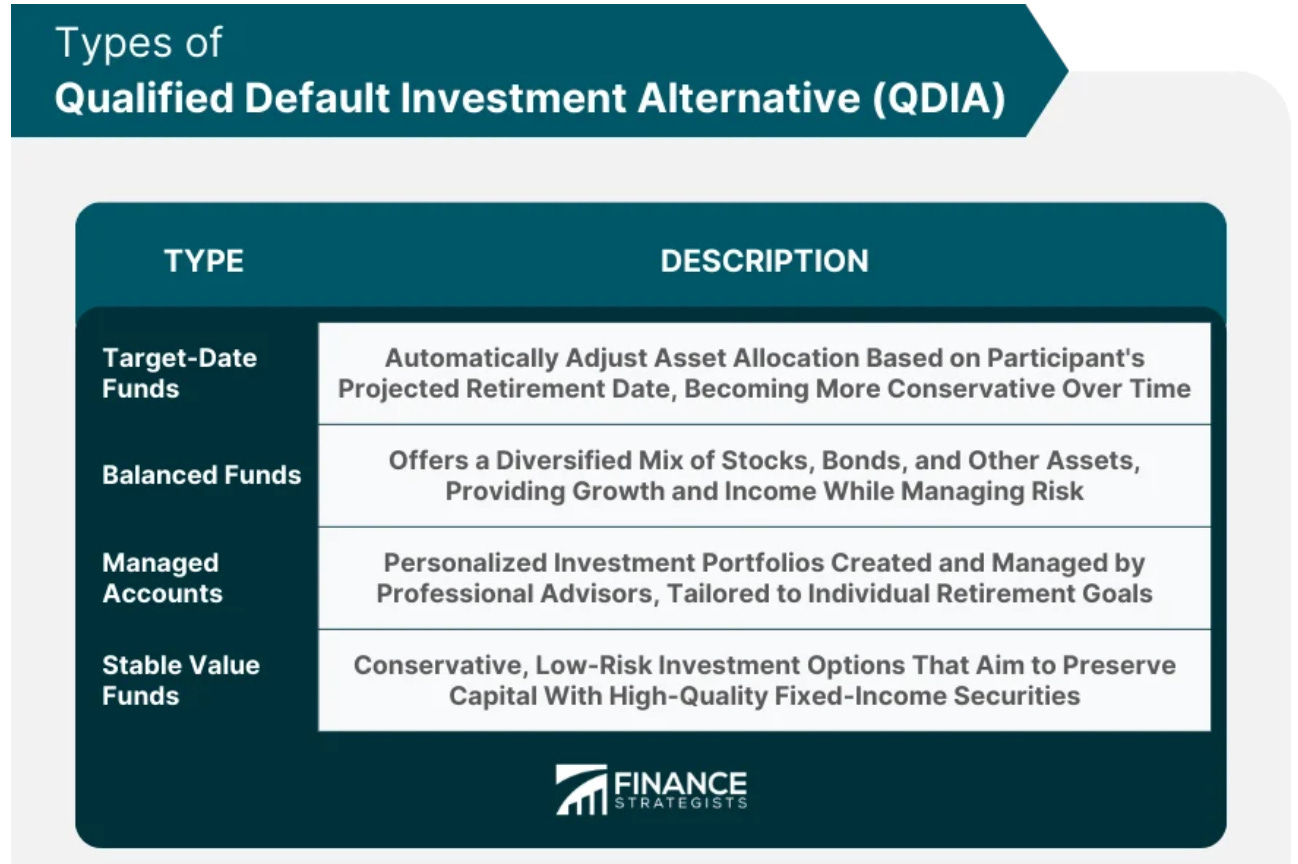
In 2006, the U.S. government passed a law that allowed companies to automatically enroll their employees into Target Date Funds and passive index funds.
They called theses types of funds Qualified Default Investment Alternatives.
The stock portion of all those is generally the S&P 500.
A look at the long-term chart of the S&P 500 is pretty telling when you know this information.
In the 53 years from Dec. 1927 to Dec. 1980:
The S&P 500 went from 340 to 525
A CAGR of 0.82%
From January 1981 to today:
The S&P 500 went from 497 to 7,801
A CAGR of 6.71%
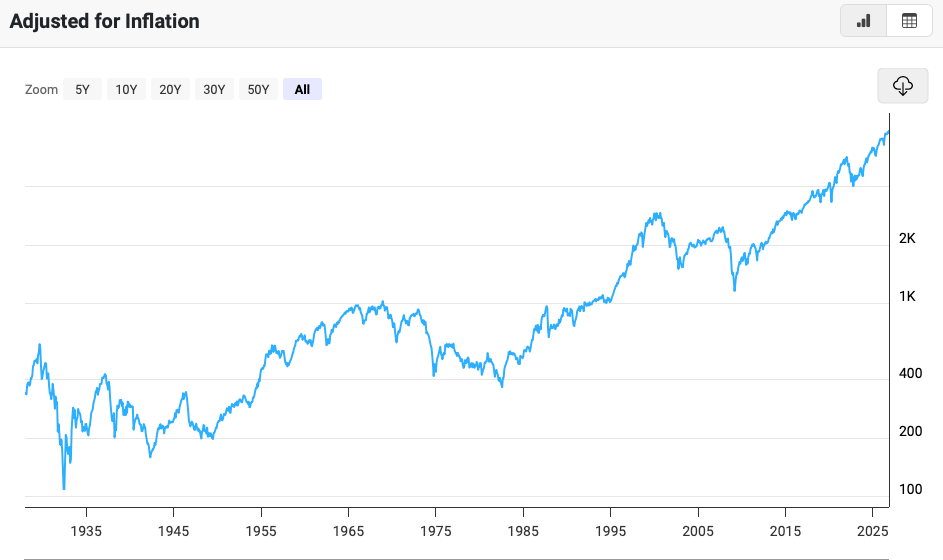
The S&P 500 changed from just a collection of stocks to the de facto national pension system.
In fact, the Secure 2.0 Act, passed in 2022 required companies to auto-enroll employees in their 401(k) plans by January 2025.
Employees can still opt out, but participating in the plan is now the default.
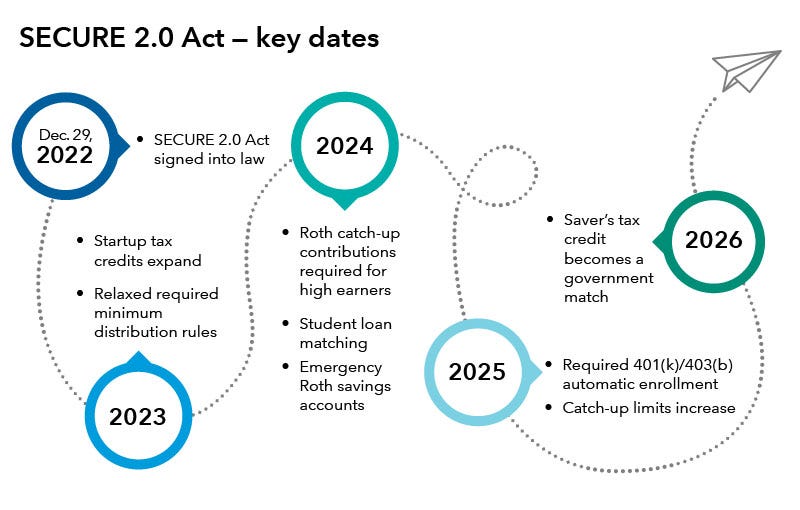
Which means that if employees do nothing, they’ll be automatically enrolled in the 401(k) plan, and they’ll likely be automatically investing in a target date fund.
Which usually means the S&P 500, plus some bonds.
Momentum and Concentration
Because the S&P 500 is market cap weighted, the biggest companies receive the vast majority of every passive dollar.
This is a self-reinforcing cycle.
The bigger they get, the more their share of the next 401(k) deductions become.
The top 10 companies used to make up about 20% of the index.
Now they’re double that at 40%.
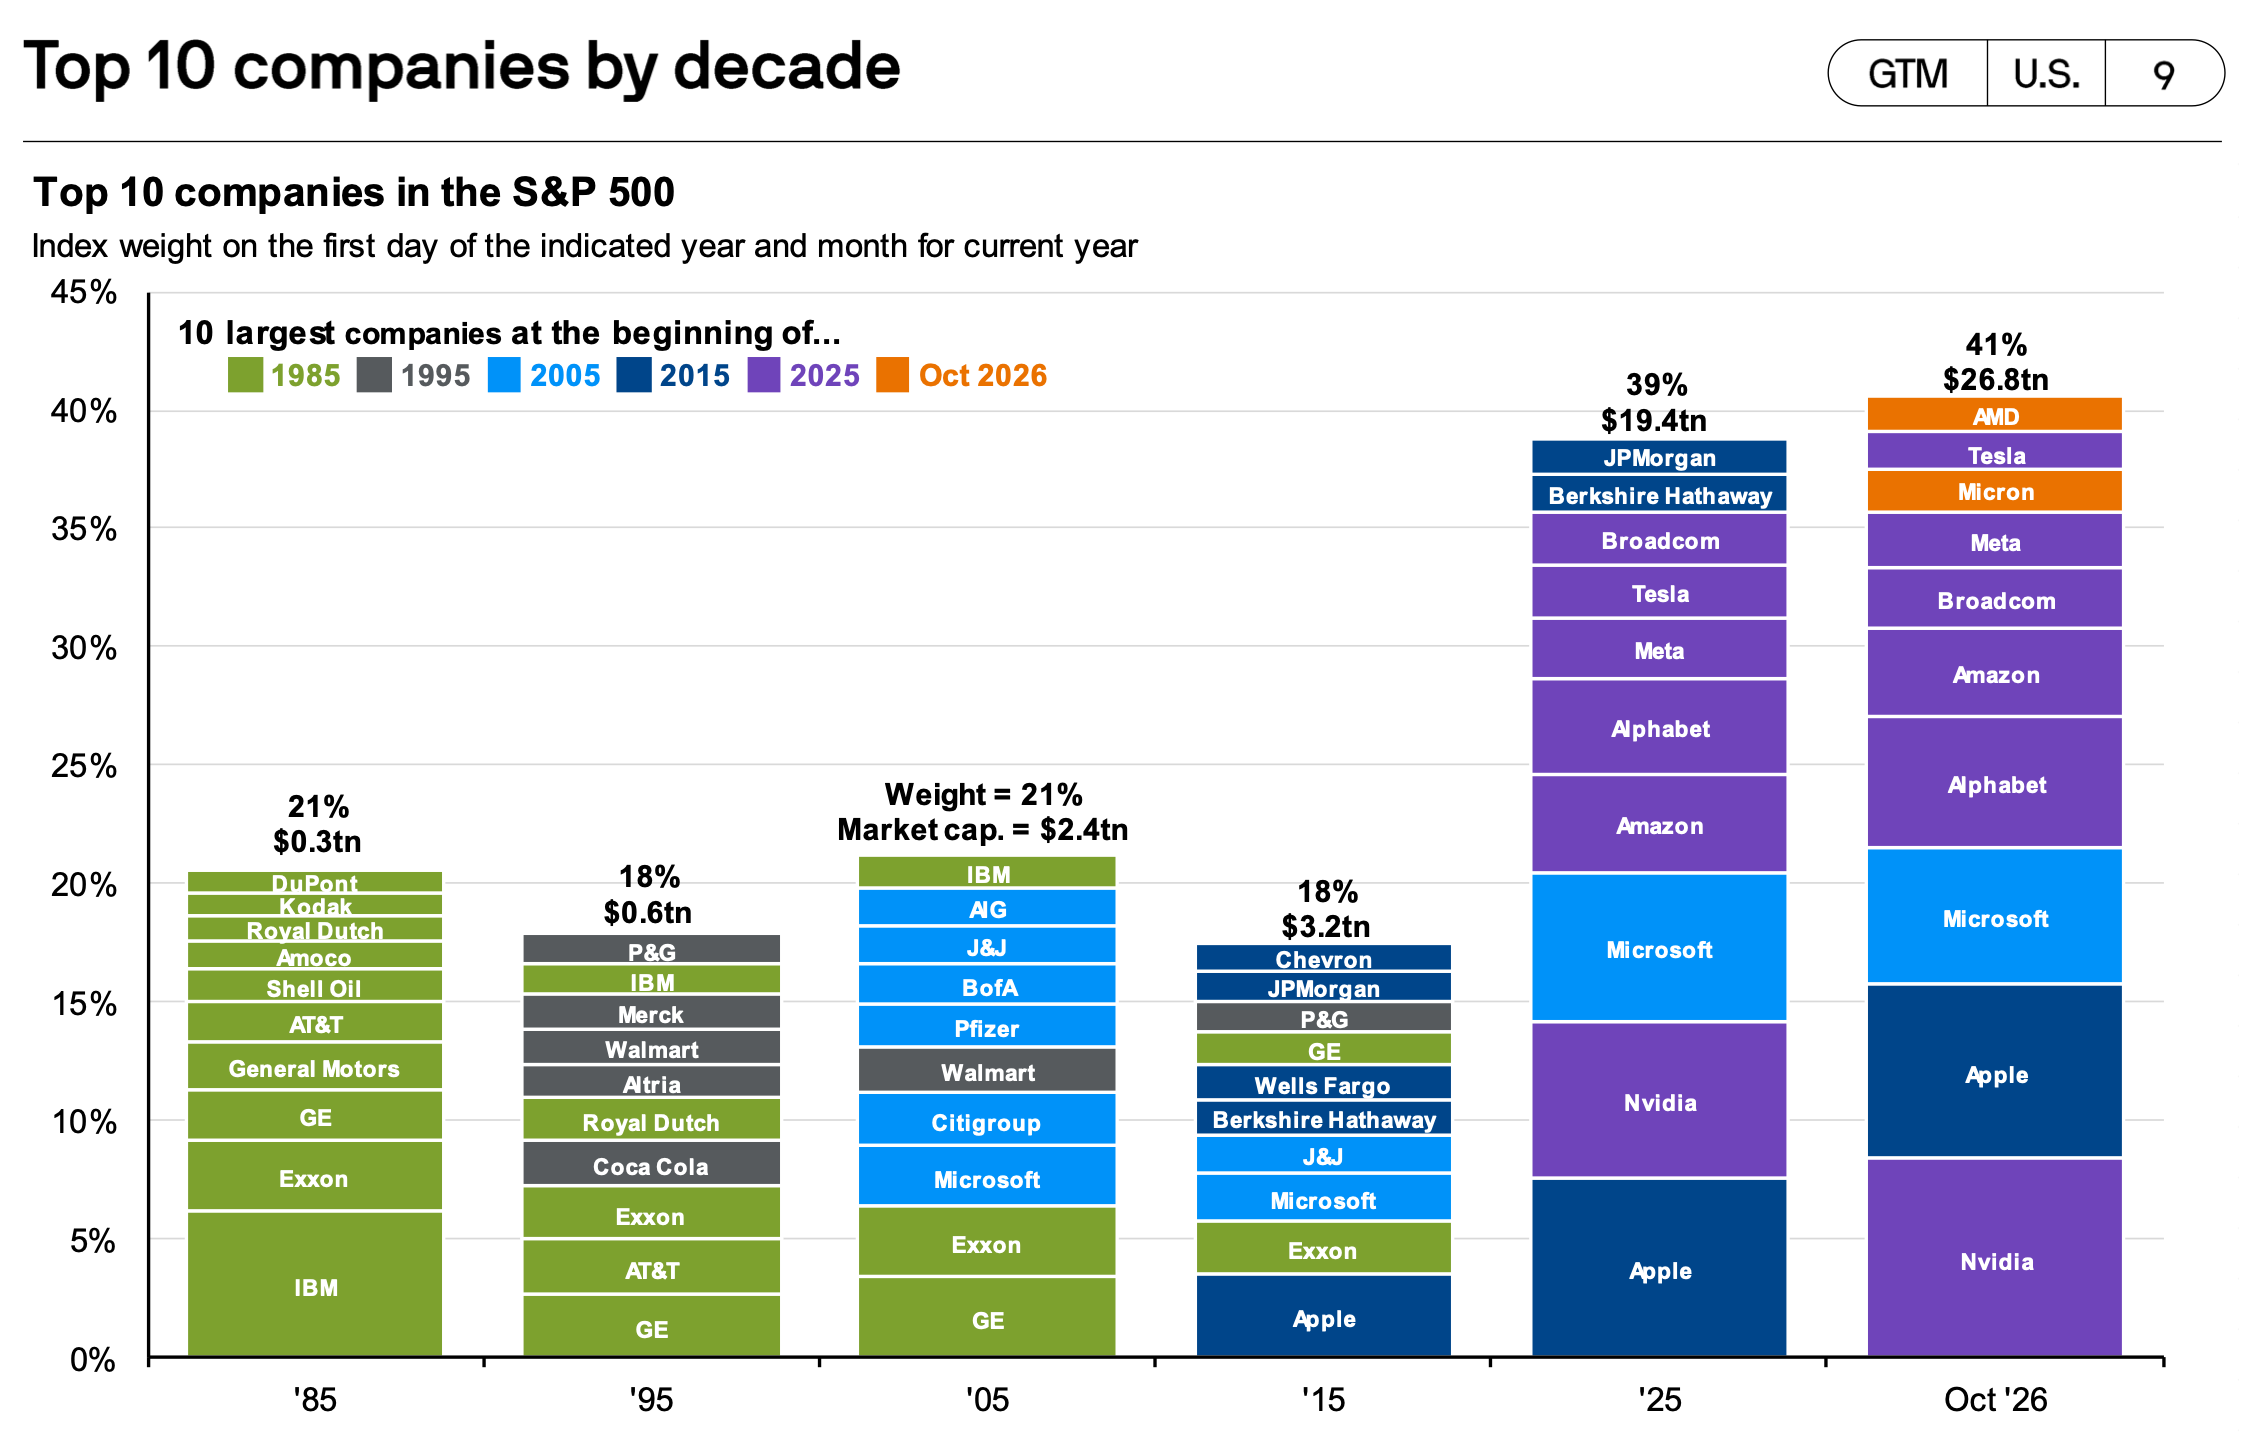
Even within the top 10 companies we can see the effects of momentum and concentration.
In the chart above, the height of each company’s box shows you its relative size.
In past decades the top 1 or 2 companies were 2x to maybe 3x the size of companies 9 and 10.
Today, NVIDIA is 5.5x bigger than the #10 company AMD.
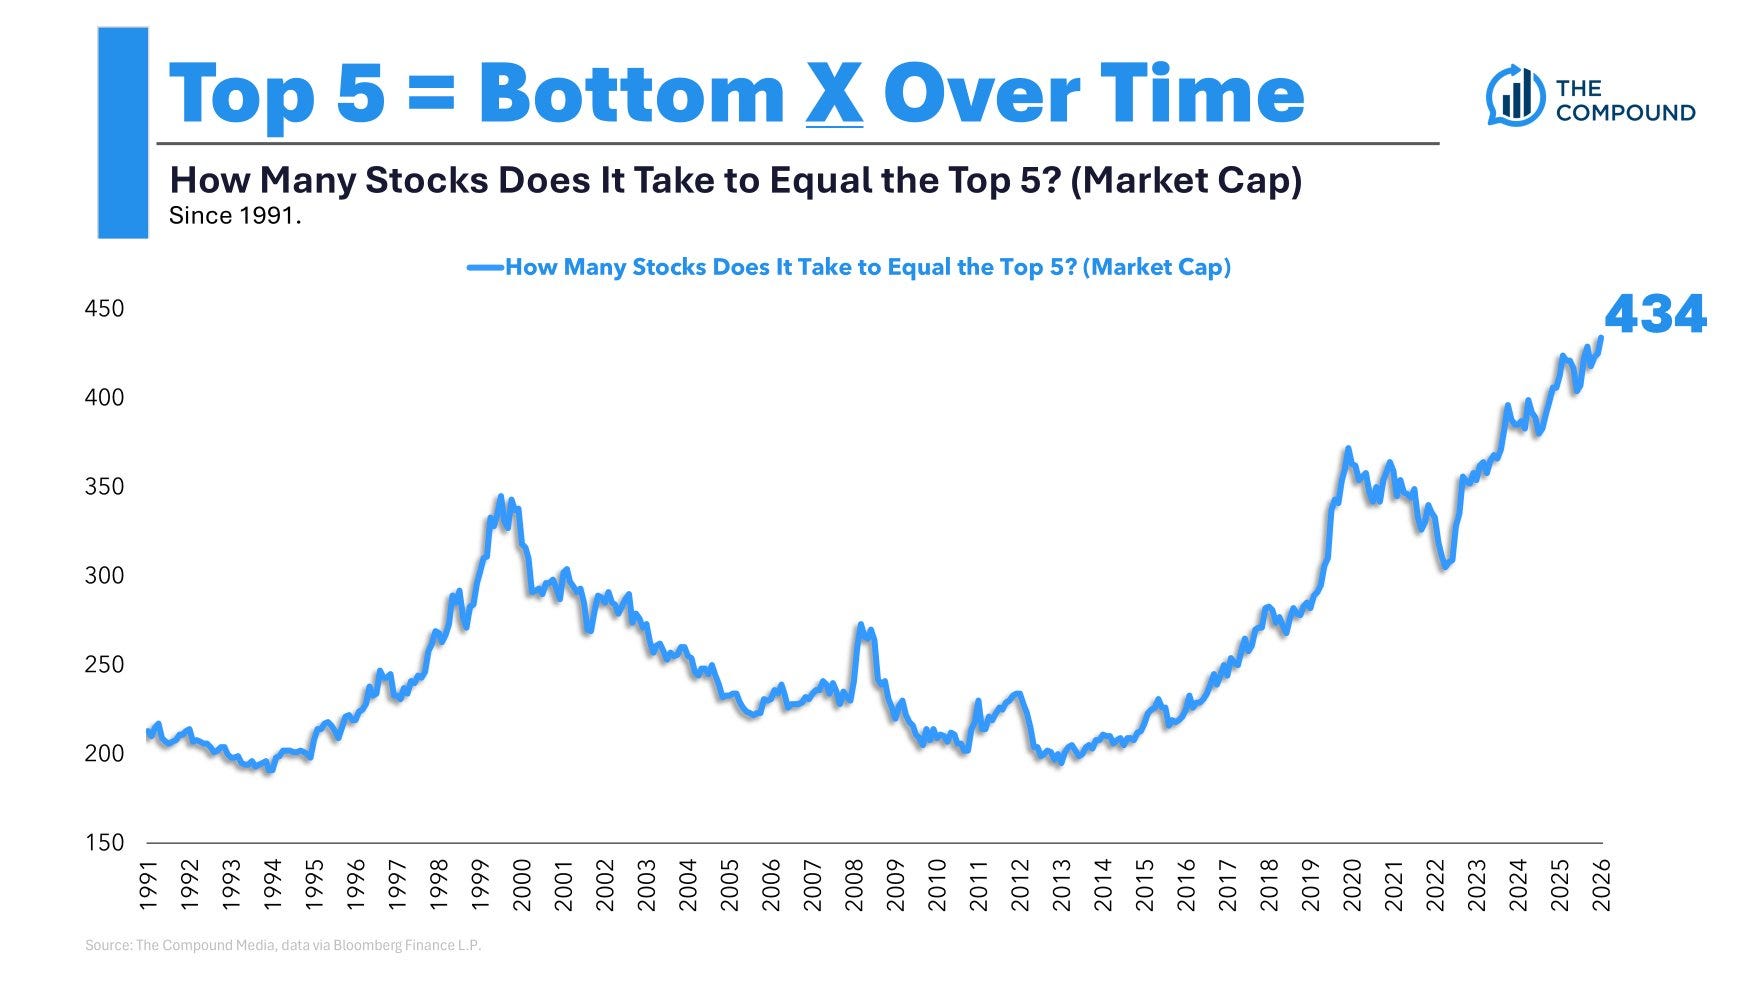
If you add the market caps of the top 5 companies today, it’s equal to the bottom 434 stocks in the index.
Passive In Reverse
So far, we’ve seen passive investing work to gradually push the index, and the biggest names in it upwards.
But with 40% of the index in AI names, what happens if that narrative cracks?
If those stocks start selling off together, the indexes have to mechanically sell into that downtrend, which will of course accelerate the drop in prices, and create more mechanical index selling.
Historically, at some point value investors and active managers would step in to start buying up cheap securities.
But the money that’s gone into passive funds hasn’t only come from new paycheck deductions.
Investors have left active managers to go passive.
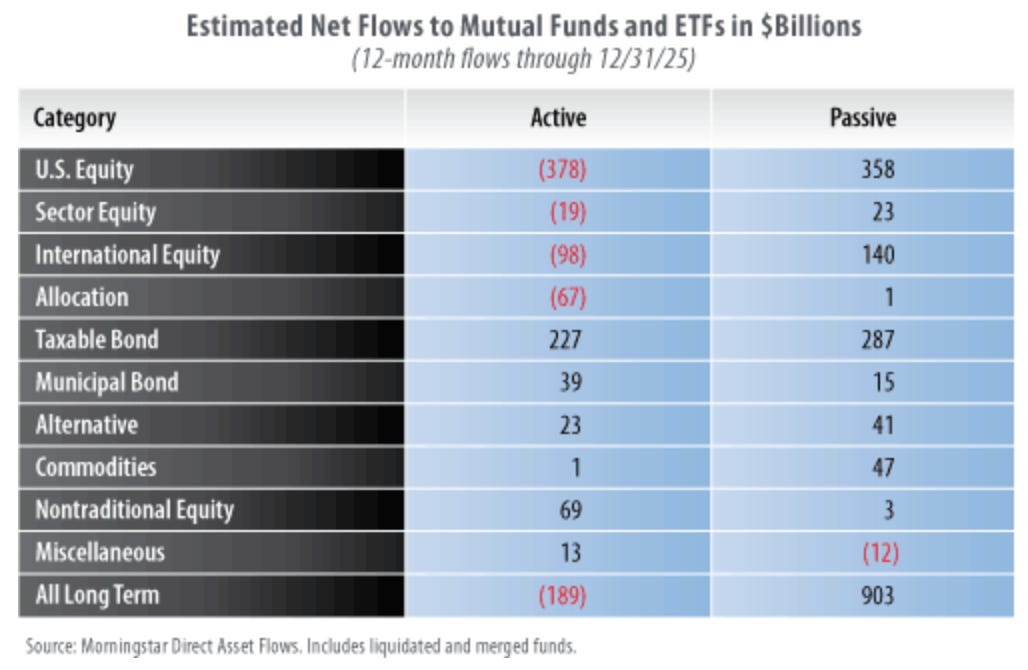
That means active managers don’t have that much money left to step in and buy with.
To be clear, this isn’t a prediction of a crash, a call to sell everything, or anything else.
This is just me trying to figure out where we are, how we got here, and what that could mean going forward.
Could the Government Save Us?
With the index concentrated in a few names, and the S&P 500 functioning as the U.S. pension fund, a drop ins’t just a Wall Street problem.
Consumer confidence could fall even further, voter sentiment would probably turn on the people in office, and it could even trigger a real recession.
High stock prices make people feel wealthier, making them spend more, which drives the economy.
This is called the wealth effect.
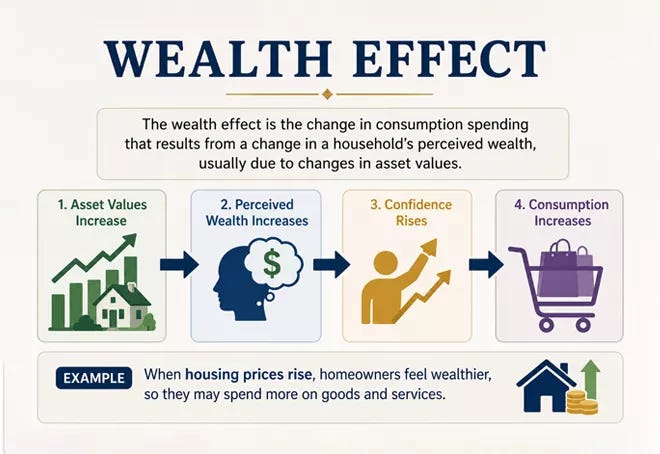
Falling stock prices would probably make that trend work in reverse.
With those potential issues on the line, you’d probably think that if the market started to decline that the government would step in.
That’s a reasonable assumption.
For the last 20 years, investors and policymakers have been conditioned to believe that whenever the market suffers a double-digit decline, Washington and the Federal Reserve will immediately step in with monetary easing, corporate debt backstops, or direct stimulus checks.
But all that previous intervention has added trillions of dollars to the Fed’s balance sheet and the U.S. debt.
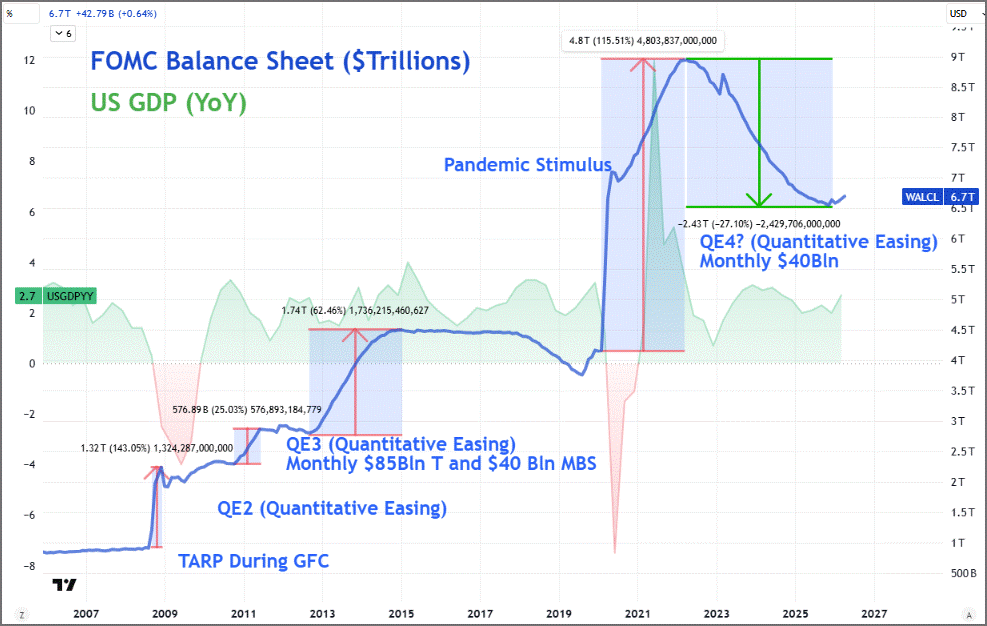
Today’s environment looks quite a bit different than in years past.
2008: U.S. Federal Debt-to-GDP was roughly 65%, inflation was zero, and the Fed had 500 basis points of rate cuts to play with
2020: Debt was higher, but interest rates were near zero
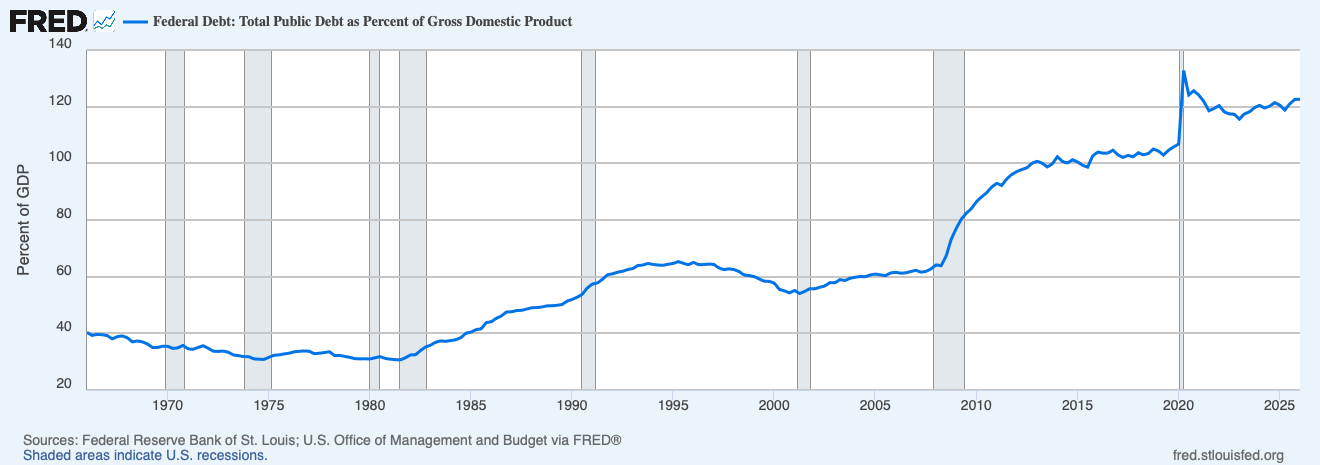
Today, the U.S. national debt is over $35 trillion, making the Debt-to-GDP ratio over 120%, or double what it was in 2008.
Interest rates are significantly higher today, meaning the U.S. now pays more than $1 trillion in interest each year.
The government now spends more on interest expenses than on defense or healthcare.
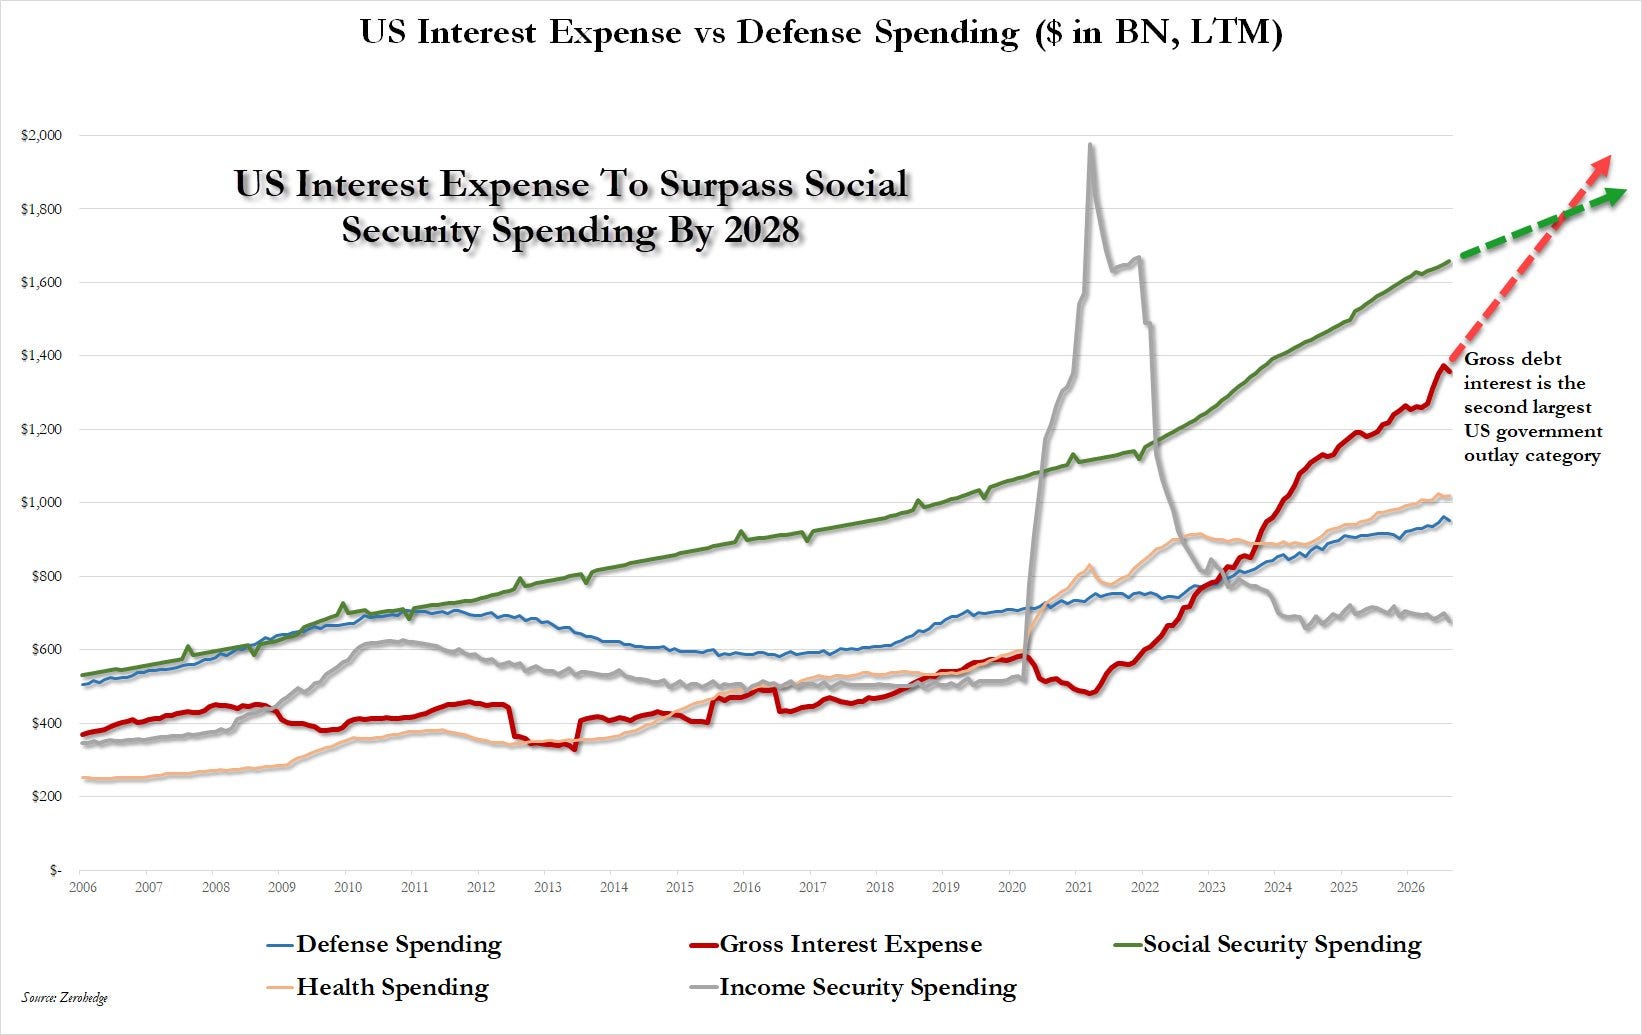
If the government tries another multi-trillion-dollar bailout, or if the central bank tries to step in, long-term bond yields will likely go up even further.
If the AI narrative breaks, and the S&P 500 starts to roll over, policymakers have a difficult decision.
They could step in to protect stock prices, and risk even higher interest rates and payments
Or they could protect the bond market and let asset prices fall, risking their jobs and a recession
Conclusion
The AI boom looks fragile to me.
There’s circular financing, increasing amounts of debt, demand could be overstated, there are real, physical constraints to how quickly everything can be built, and there’s growing resistance to data centers.
It could work out, but history says we’ll likely get ahead of ourselves.
When you combine all of this with a stock market that’s dependent on it, a government with less tools to fight a drop in stock prices, and a bond market that’s already nervous about U.S. debt levels, you wind up with a whole lot of places I don’t want to invest.
In the final part, we’ll talk about how I’m thinking about this and where I do want to invest.
See You There
-TJ
Used sources
Interactive Brokers: Portfolio data and executing all transactions
Fiscal.ai: Financial data
Disclaimer
As a reader of Compounding Dividends, you agree with our disclaimer. You can read the full disclaimer here.
The 401(k) history was new to me. Wild that a tax loophole from 1978 basically turned the S&P 500 into the national pension. The top 10 being 40% of the index feels a lot less abstract when it's coming out of everyone's paycheck every two weeks.
Great series of articles. The big question is when will this capital cycle turn and how abrupt will it be. For example, will it be in 1 year and drop off a cliff or will it be 5 years and gradually reach an orderly steady state. This leaves us with two things to do: 1) find the early warning signs of a cycle shift. 2) allocate at least 2/3 of holding to non-tech quality businesses like WM, ITW, PG, PM, KMB, O, MA, WAT, BDX and 1/10 to cash . Even if it means you might not beat the S&P this year. Yep, trying to beat the S&P is a risky organizing principle.